Target your next best customers with geospatial intelligence
Area Prioritisation Engine (APE)
You’re wasting marketing spend
Here’s where your most profitable customers actually live
Get a free analysis of your top 5 target areasStop targeting the same customers as everyone else
Your best buyers are hiding in plain sight
Most retail teams target the same postcodes and customer segments year after year – because that’s where ‘the population’ and ‘spending power’ look highest on paper.
The problem? Everyone else is doing the same thing, driving up costs and lowering ROI.
Our Area Prioritisation Engine pinpoints where your next best customers live – so you can grow faster without spending more.
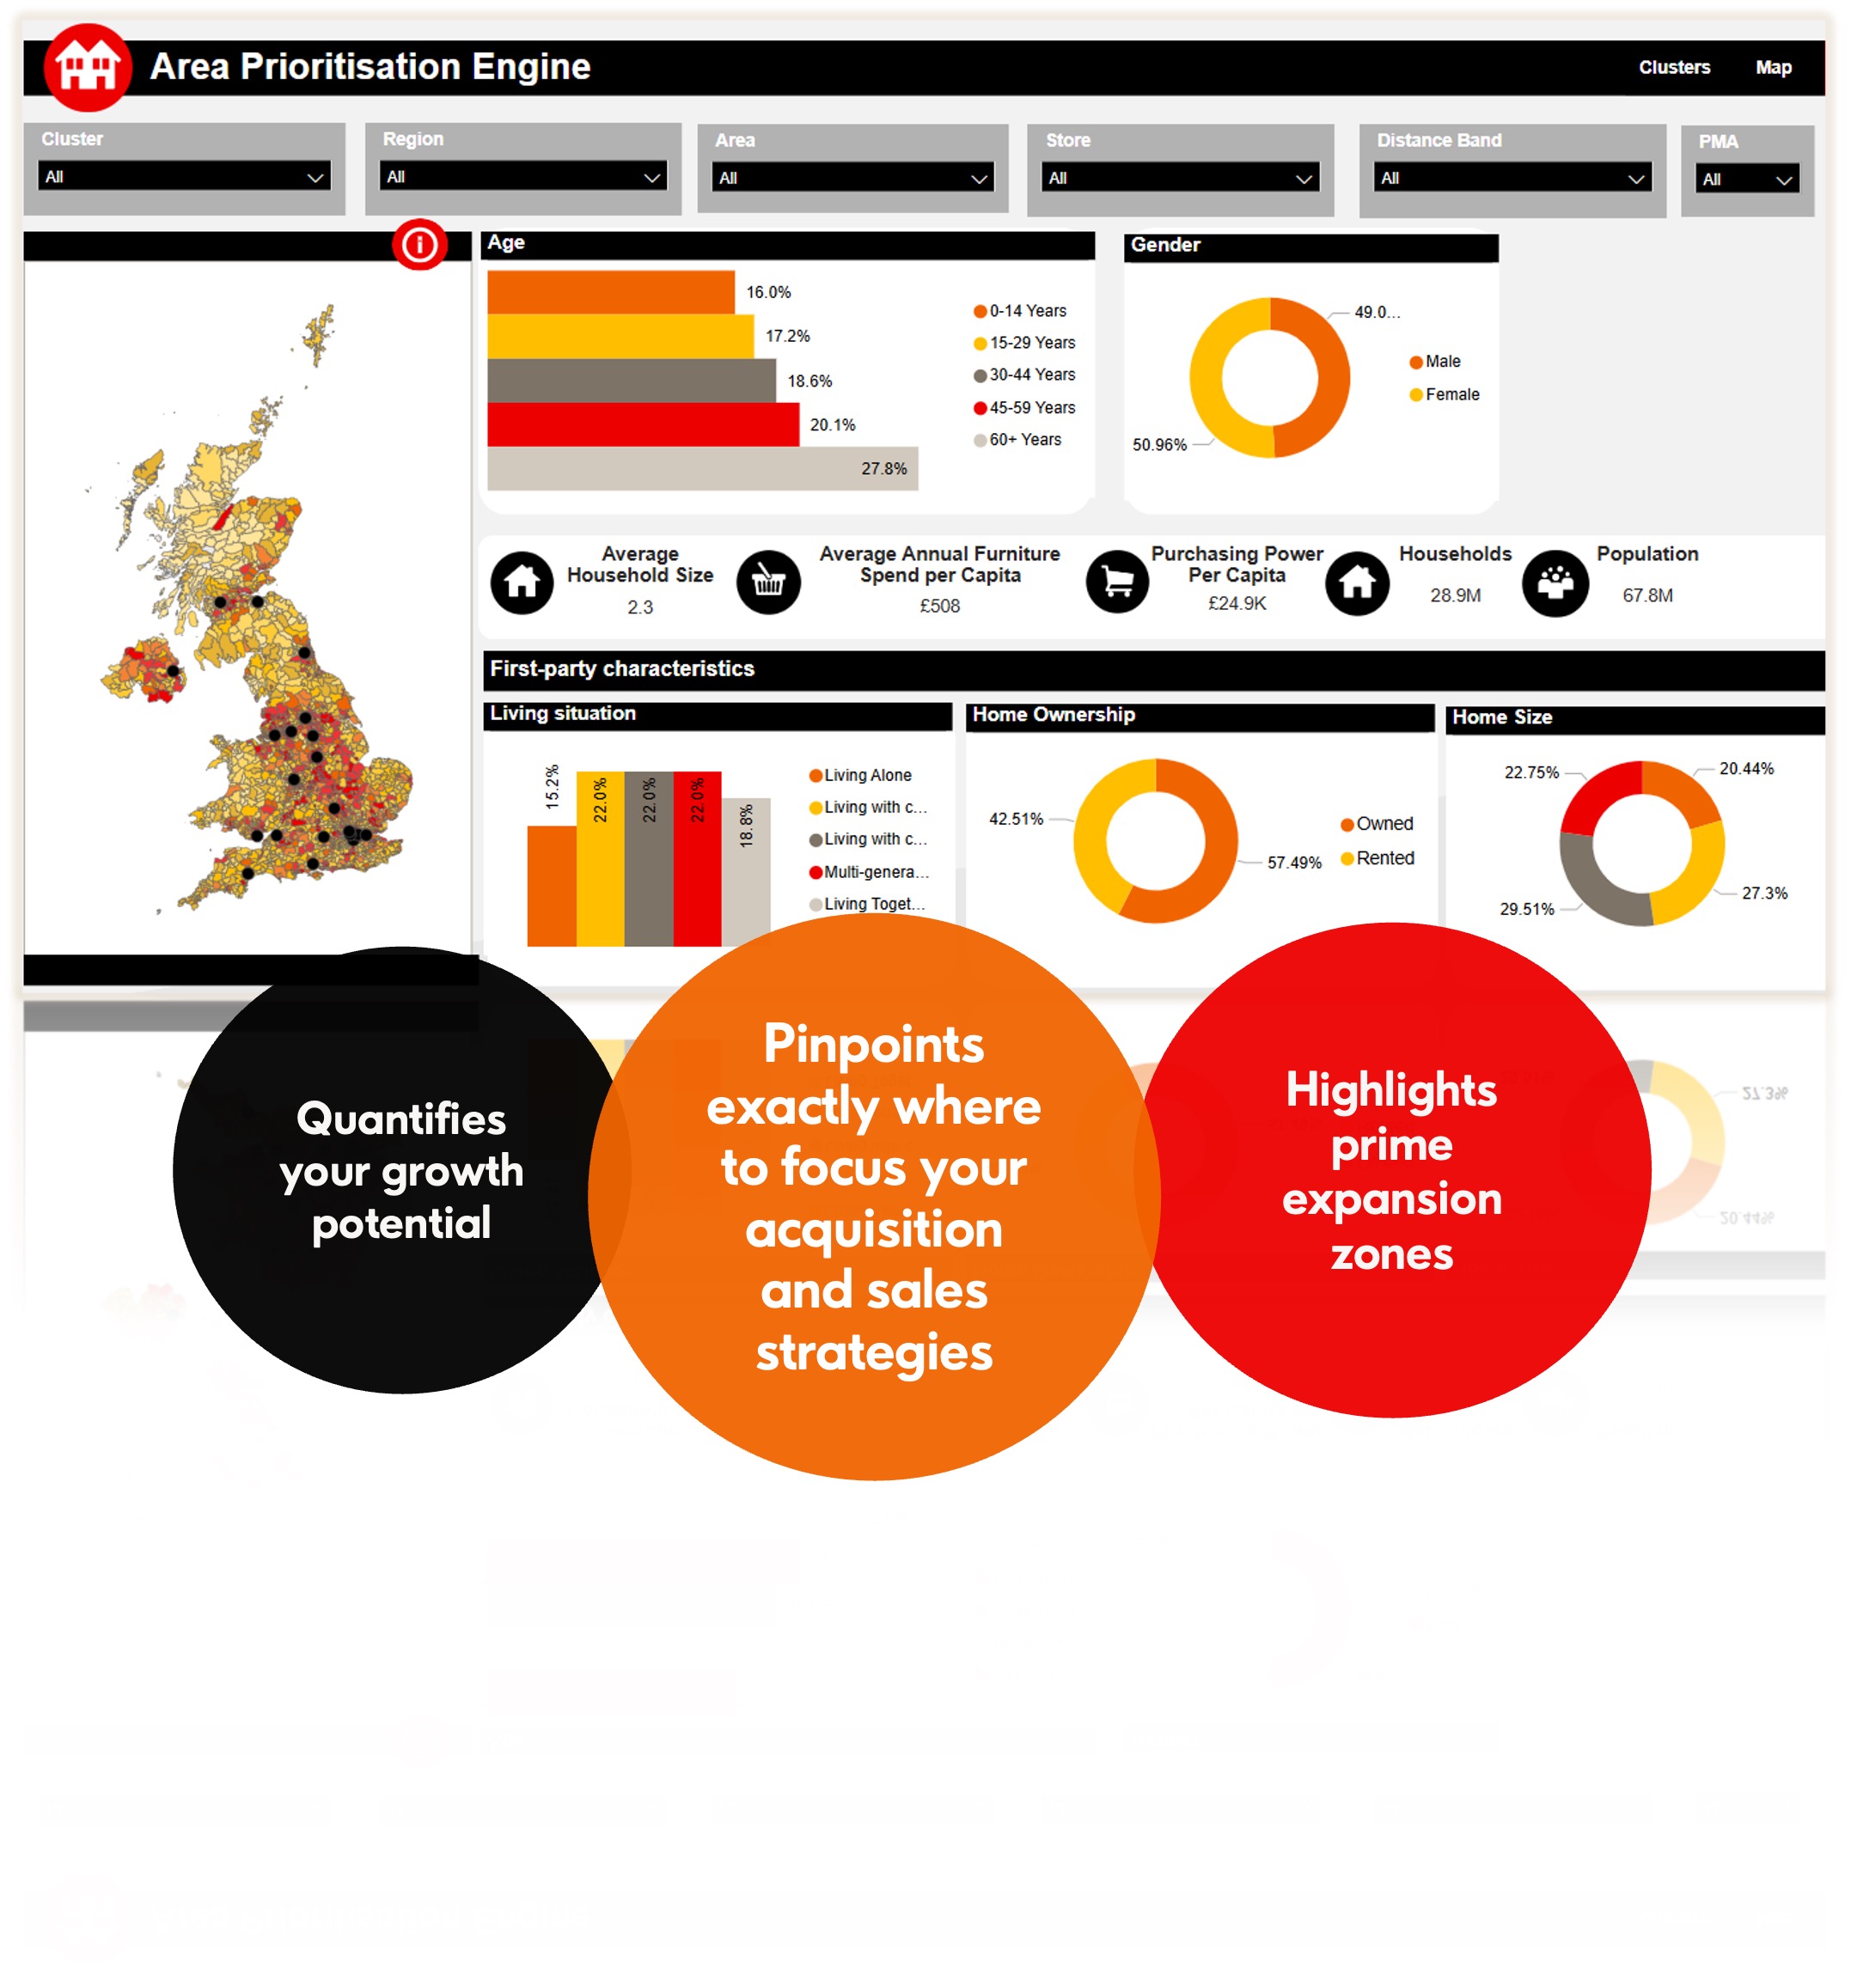
APE’s suite of smart solutions
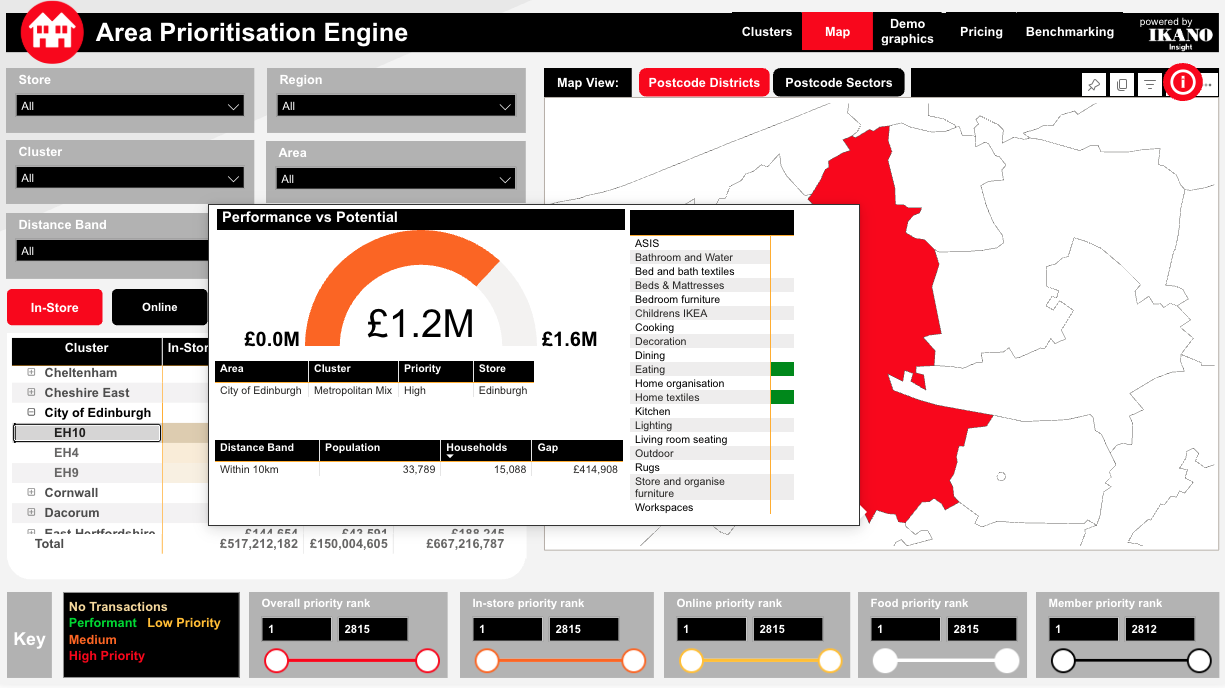
Map your true market
See current contribution versus true sales potential for every postcode area in the country, specific to your business and category.
Define the precise potential value of every neighbourhood in your market, see the gap between current sales and what you could achieve.
Focus on the best areas with laser-like targeting, to accelerate your growth, maximise return, and minimise wastage.
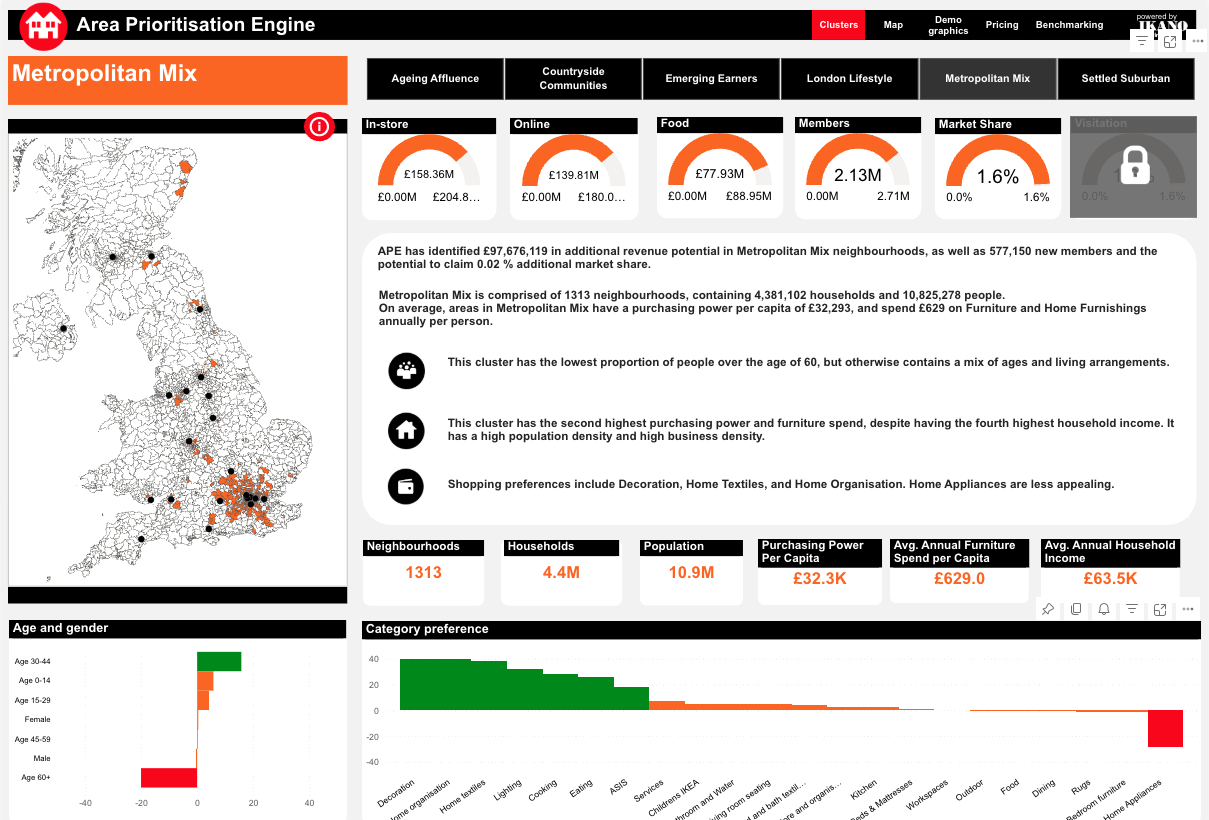
Enable smart targeting
Understand the key customer cluster-types countrywide, who hold your greatest sales opportunities, and exactly where you will find them.
Know the demographic profile, the purchase and spend behaviour in-category, channel habits and more for every area where they are.
Precisely target the most valuable people, with the right product and channel messaging, in each area where they are.
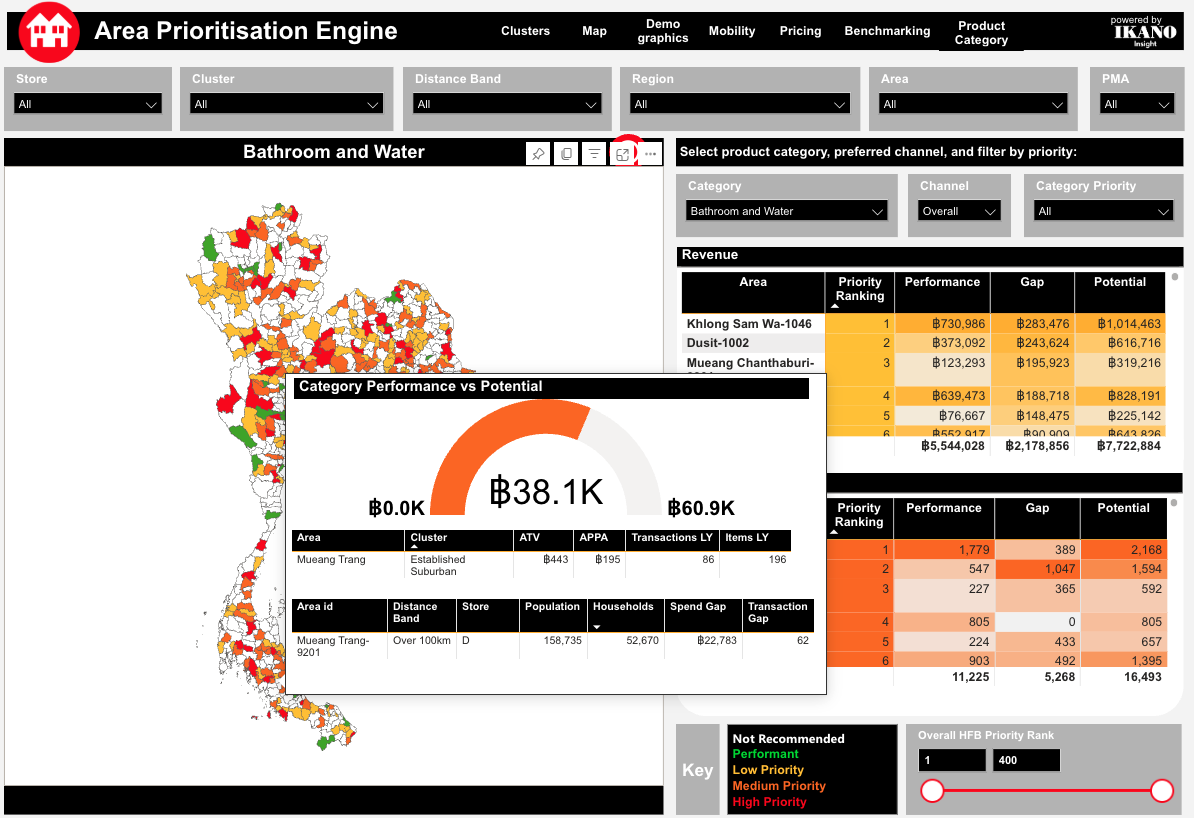
Decode product demand
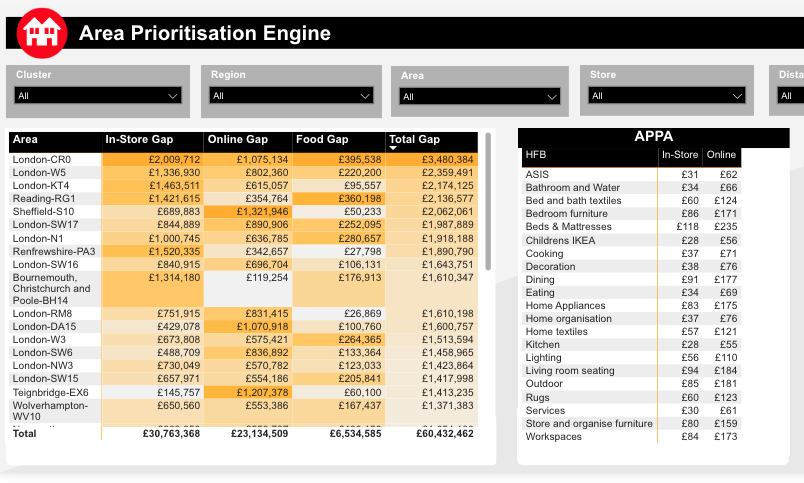
See current contribution versus true sales potential at product range level, to understand customer product demand, and target accordingly.
Manage inventory and promotions more efficiently and profitably, around which products customers do and do not favour.
Respond to specific product demands, in the areas where gap between demand opportunity and current sales is highest.
Price accurately
See the customer purchase and spend behaviours in every area, for your specific product ranges, including prices paid.
Understand product demand preferences and price expectations, to fine-tune your offering versus your competition.
Target specific areas with the right product and price offers, to maximise traffic and sales.
Optimise store location
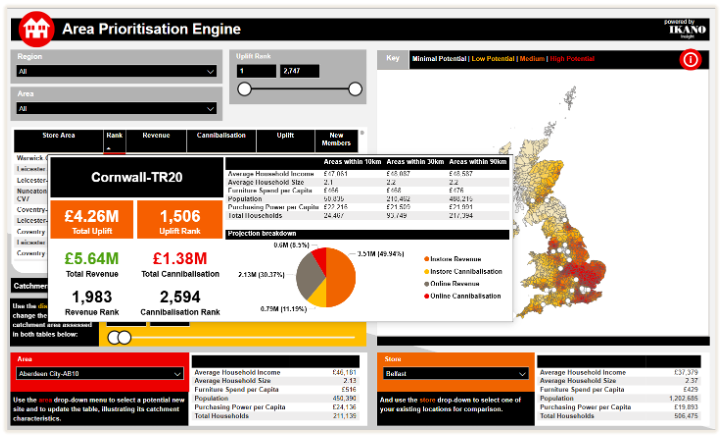
Quantify the potential sales revenue from every area of the country, of a new store opening in any location of your choice. Know where to open and where to close.
Know exactly what the cannibalisation impact on all existing stores would be, versus overall revenue uplift to be confident of return.
Understand the new audiences in every area, who/where to prioritise first, and what will motivate them best to your new store.
How it works
Using a representative sample of your data – like deliveries by postcode, or loyalty members in a given district – our algorithm provides you with a ranked list of neighbourhoods where the most potential customers live, along with exactly how much value you can expect to unlock.
It predicts which areas offer the greatest potential.
You can have either:
- A recommendation report, specifying which areas hold exactly how much potential value for your business, and detailing the characteristics of neighbourhood profiles to support your targeted marketing.
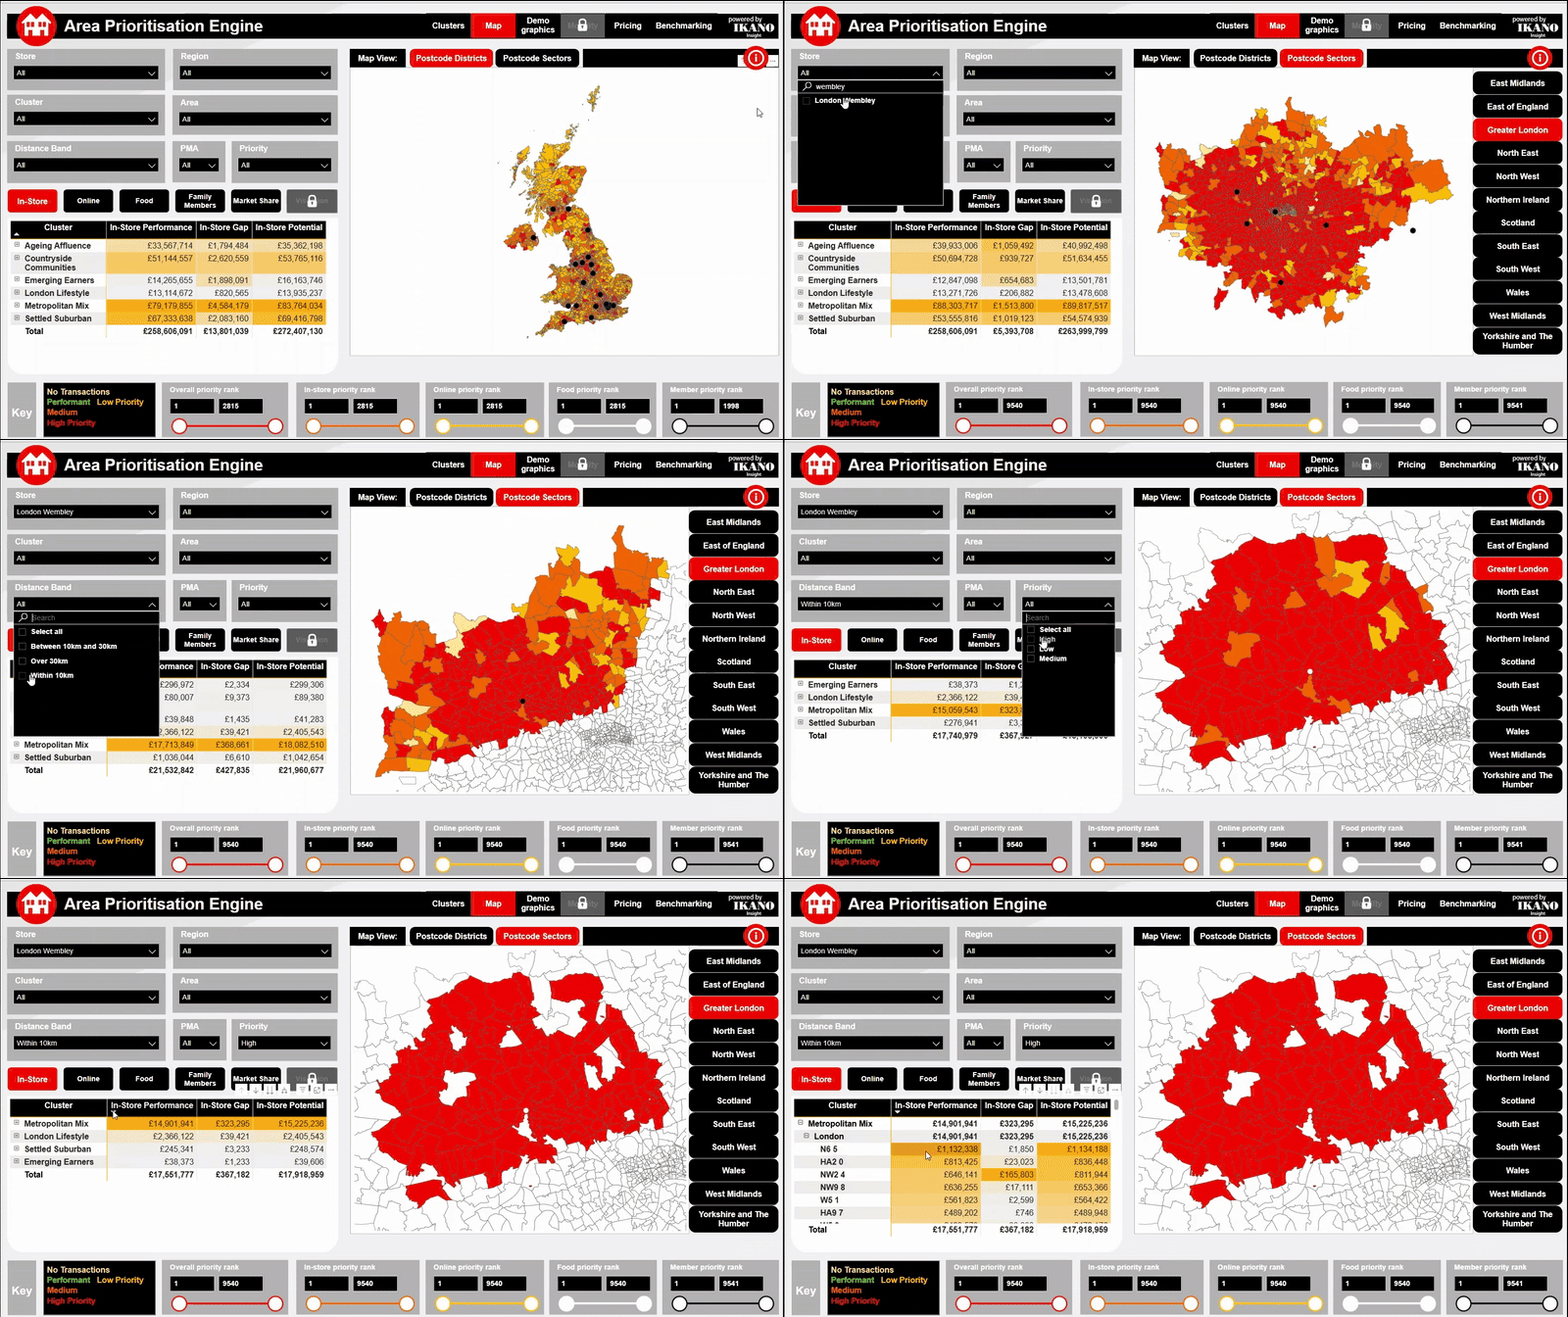
- An interactive dashboard, allowing you to analyse the characteristics of each area and to explore your results in more detail to maximise their impact.
The ultimate sales planning tool
Need to find growth with a limited marketing budget?
APE identifies which neighbourhoods will deliver the greatest return on your spend, and tells you how much
Under-performing stores, outlets or branches?
APE can tell you the TRUE potential value available to every store from every area around those stores
Where can you find completely new customers?
APE will map where high value customers you have never seen are, incl. their category spend
Need to grow new market share quickly?
APE will tell you which areas to target first, who the customers are, and what motivates their purchase
Unsure about a new store opening?
APE will tell you what the sales return will be from each area around the new store, plus cannibalisation values
Need to manage product inventory more profitably?
APE will tell you product preferences and price expectations of your target audience in every area
Get a free report and demo
Book a 30 minute demo call to see first-hand how Area Prioritisation works, discuss how it can make the most impact for you, and get a FREE report on your top 5 postcode areas (specific to your business and product):
Area Prioritisation Engine success
Frequently asked questions
Why is area prioritisation useful?
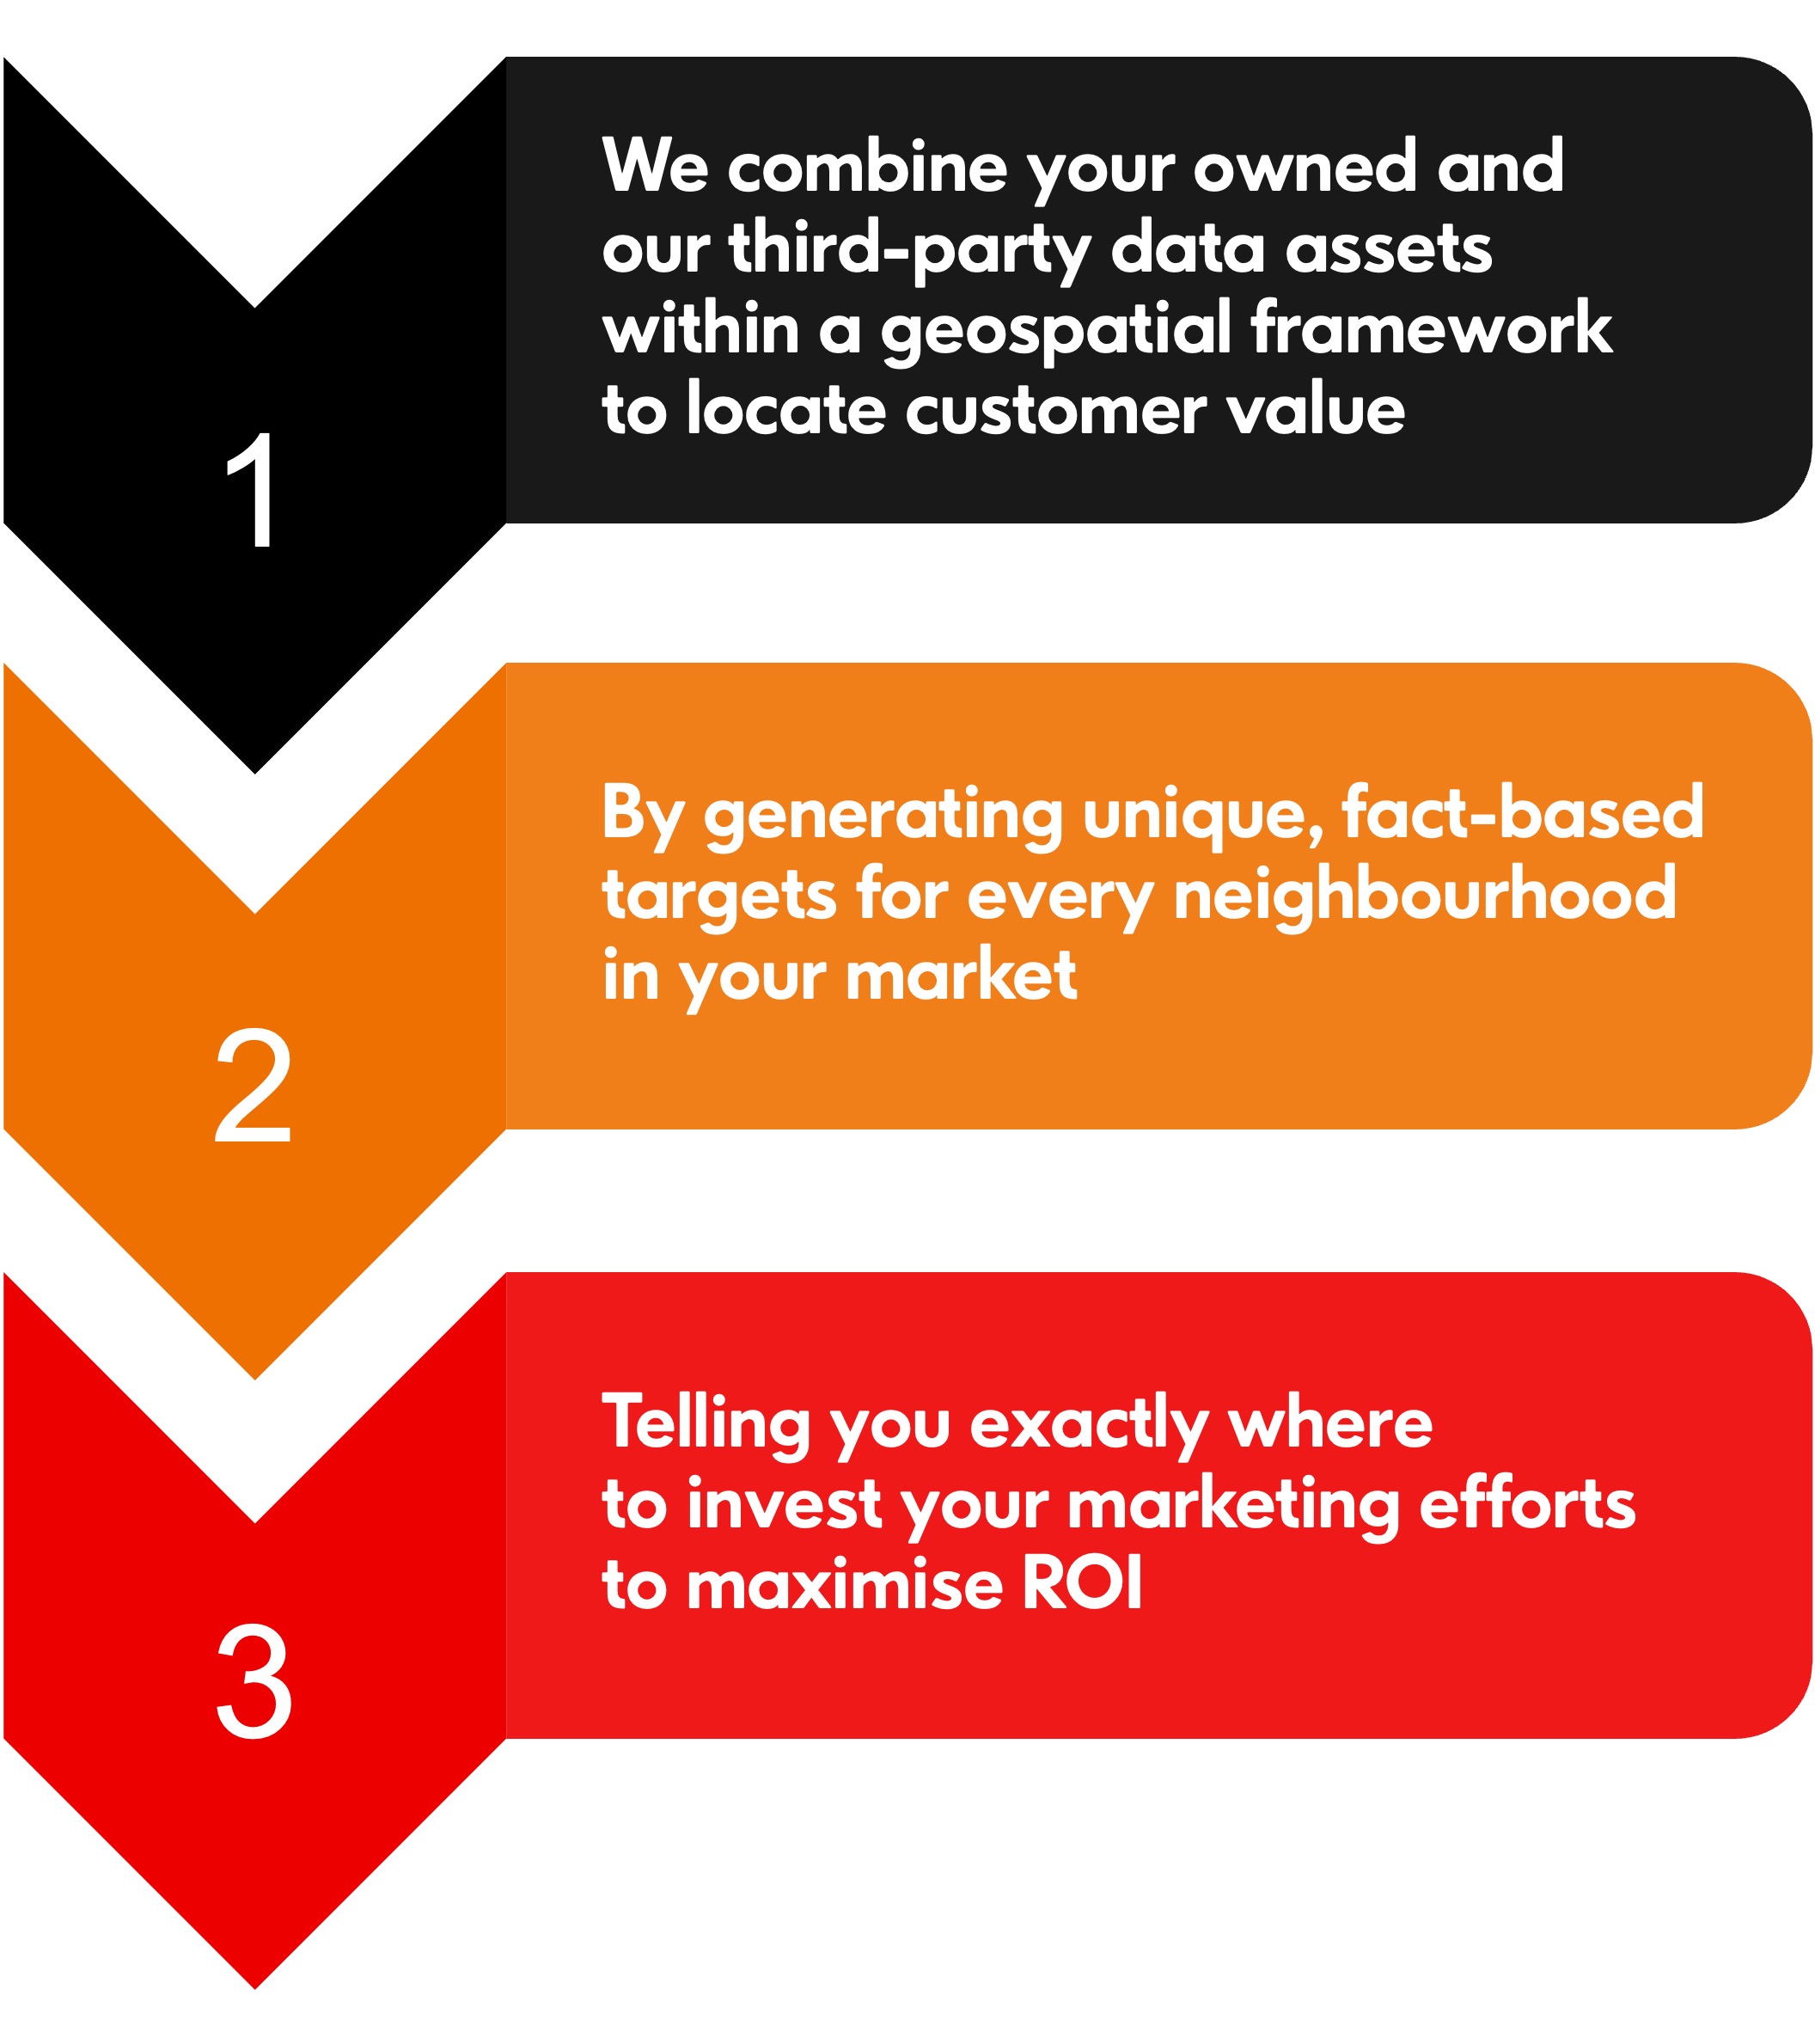
Analytics engines such as Area Prioritisation work by analysing customer data such as browsing history, past purchases, etc along with supplemented third party demographic information, all overlaid with a geospatial framework, to predict what products a user might be interested in, what channels they prefer to use, how much money and how often they are inclined to make such purchases, and most importantly WHERE they can be found.
In this way, a business can identify who and WHERE their most valuable customer opportunities are, and how much value they represent.
What role does consumer mobility data play?
Consumer mobility data uses permission based location data available from mobile devices, to analyse where customers shop, how often, for how long, and most importantly at which specific stores or brands.
This enables a business to create direct comparison analyses between themselves and all their competitors.
This mobility data plays a huge role in predicting channel, location and brand preferences, along with broader product preferences.
Does APE require personal data?
Area Prioritisation Engine doesn’t require any sensitive or personally identifiable data to be shared in order to work.
Only data that has already been aggregated to postcode or sector level is used, unless you specifically request support in transforming your data or pipeline development.
How do area prioritisation engines handle privacy & data security concerns?
Recommendation engines should implement data anonymisation techniques, encryption, and access controls to protect user data and address privacy concerns.
Beyond your own first party data, all supplemented third party data must be permission based and compliant with relevant local privacy legislations.
Is APE only for large businesses or retailers?
APE works for any business which can associate their performance data to a geography, and if you include the mobility data option, even that is not required.
If you’re a business with a loyalty scheme that includes customer address data, or sales data that’s associated to a delivery addresses, APE can help.
How can businesses measure the success of their area prioritisation engine?
Businesses should ensure that all targeted marketing campaigns or direct sales activities implemented as a consequence of area prioritisation insights are tracked and measured, ideally using control groups, to identify subsequent response in consumer behaviours.
Examples of success metrics to track include email or social click-through rates, conversion rates in terms of response, visitation and sales, customer satisfaction and overall revenue, or even reductions in basket abandonment.
Is APE only available in the UK?
APE is available in most markets globally – if you’d like to cover multiple markets, just let us know.
Useful resources to grow your customer value
Do you need to win new customers more efficiently?
Improving your sales and marketing with highly targeted, relevant communications will drive reduction in cost per acquisition, and increase in order values and customer loyalty.
If you’d like to discuss your specific requirements, just get in touch here:


