Retail data transformation across 5 markets and 12 stores
The client
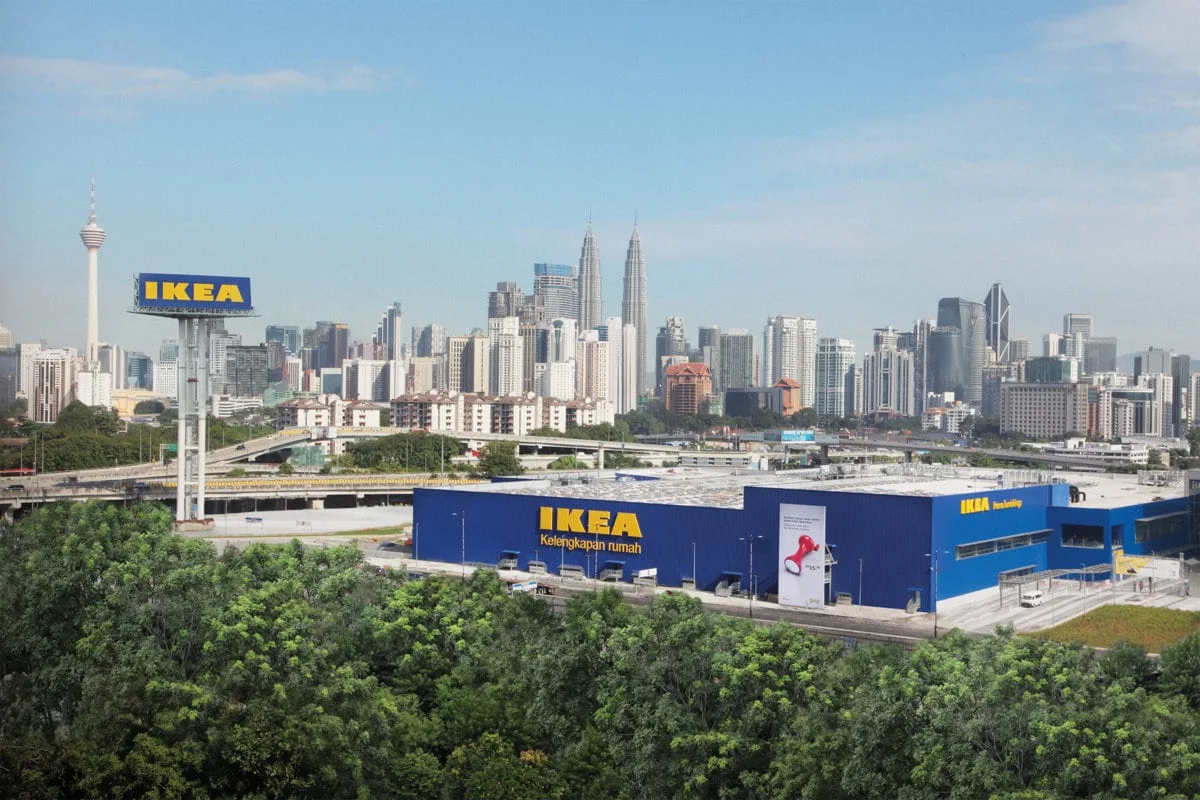
With 5 Ikano Retail Shopping Centres and 12 IKEA stores across Southeast Asia, including Singapore, Malaysia, the Philippines, and Thailand, plus one more in Mexico, Ikano Retail collects, stores and analyses enormous amounts of data from multiple locations and departments every day. Some might say the epitome of Big Data.
As a customer-orientated organisation, Ikano Retail are focused on achieving a comprehensive understanding of both their business and their customers which is key to their growth. No mean feat, when approximately 16 million customers visit their stores each year, and they are processing an average of 45,000 transactions each day.

The challenge
Ikano Retail is a complex business, with fragmented data sets, distributed across multiple locations, residing on different systems, and collected from multiple sources.
In order to start using this incredibly valuable data universe, they needed to find a way to centralise their data into a single location. Once consolidated, they would need to be able to analyse data, extract necessary insights, and make rapid, data-led decisions that would grow their business.
Ikano Retail also desired the ability to display a comprehensively defined set of KPI’s, both at a local and individual store level across any of their regions in real time, in a way that was clear and easy for all co-workers to understand.
The solution
As the data analytics and business intelligence partner to Ikano Retail, Ikano Insight executed the data warehouse and dashboard capability of their business-wide data transformation strategy named “Data to Insight” (D2i).

Data transformation
To kick-off this transformation project, we spent time with Ikano Retail’s data team to conduct a full data audit. A data discovery session then allowed us to understand the insights they wanted from their data before reviewing the format and functionality of the systems they currently had in place, as much of the data was not stored in a consistent way, with differing formats and file types.
This initial review allowed us to understand what was required to transform the data into a standardised format across all systems and locations, adapting existing or creating new extract, transform and load (ETL) processes, and identifying the optimum data platform solution.

The process
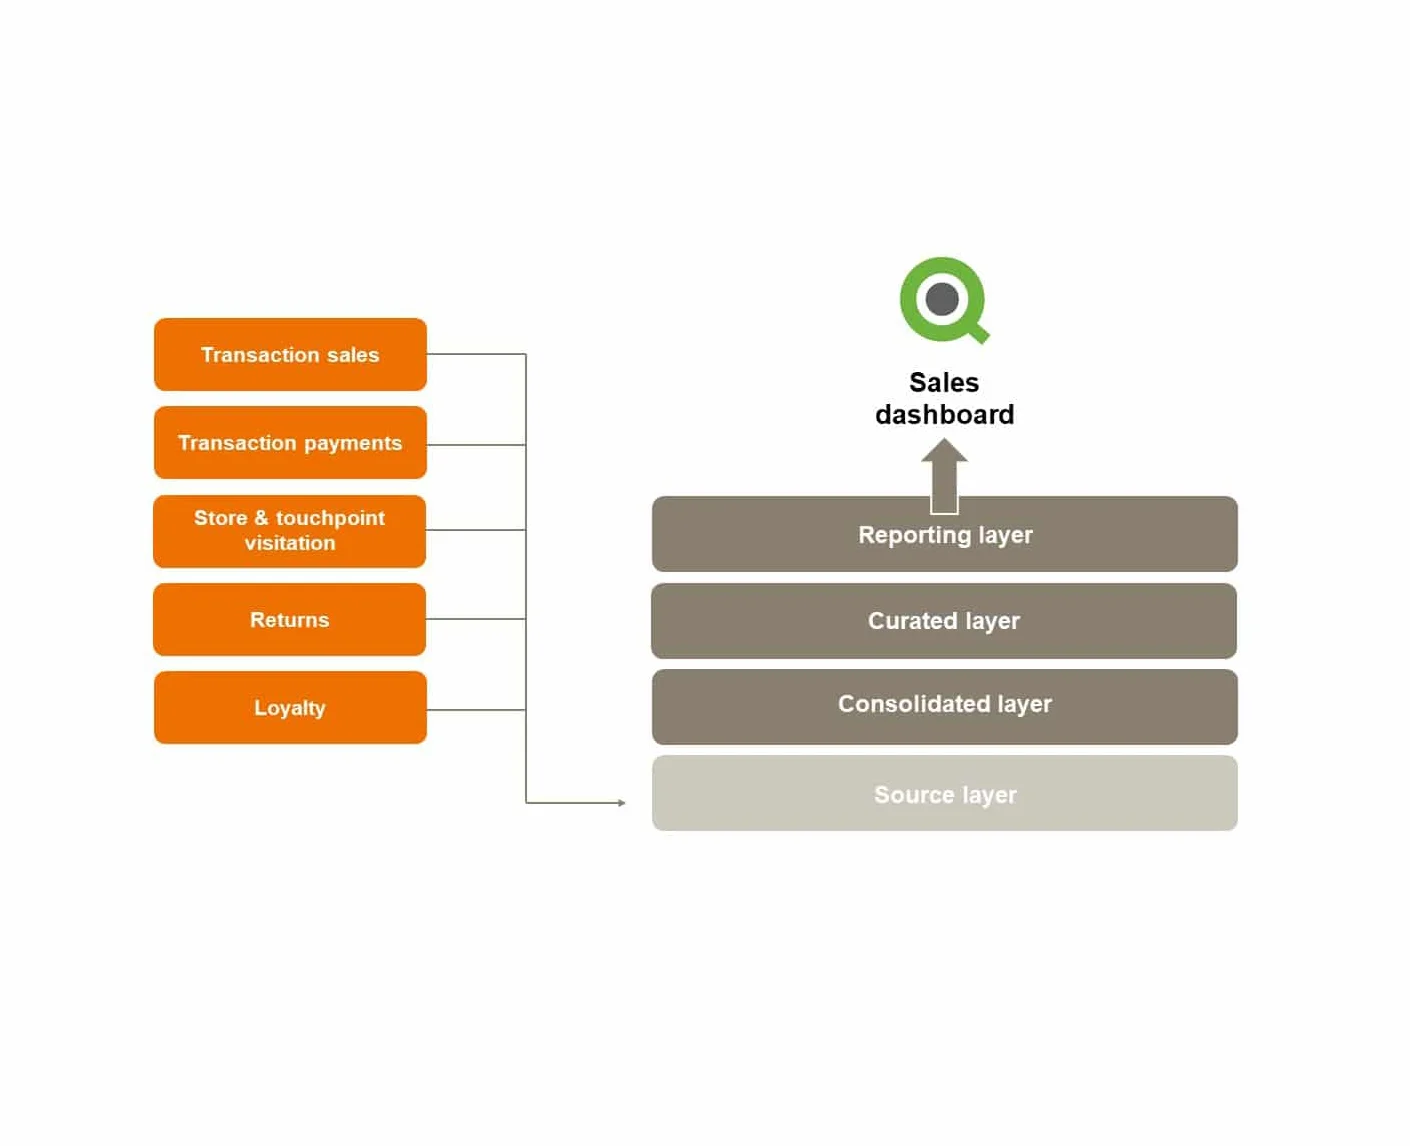
We are now extracting data from a huge range of fragmented and disparate data sources, and integrating these into a robust, scalable Microsoft Azure cloud solution. This single platform was designed and built specifically to meet the needs of Ikano Retail.
Having all the data in one place allowed us to create a new analytics environment, enabling much faster data processing than before.
Examples of data sets include:
Sales transaction data
In-store and online visitors
IKEA Family (eCard) data
Services and delivery data

Data visualisation dashboard
The second stage of transformation was to build multiple, custom data visualisation dashboards. Following a discovery session with the client, we defined a suite of dashboards covering all aspects of the business.
Each of the dashboards are built on Qlik Sense by Ikano Insight data and visualisation experts, after specifying a common KPI set through user stories developed with various business units and pulling all data through from the Azure data warehouse solution.

The outcome
The purpose of these dashboards is to give Ikano Retail co-workers the ability, to obtain insights, information and data anytime, in an instant.
Ikano Retail commissioned Ikano Insight to build the dashboards for various business areas, the first one being the Sales dashboard, followed by Loyalty, Services, Customer Relations, Shopping Centres, eCommerce, Furnishing GPR and Workforce.
The aim is that the dashboards will empower co-workers to act upon the meaningful data insights provided by them, and identify opportunities for improvement which is key to future growth.

The results
This long-term partnership between Ikano Insight and Ikano Retail means there are multiple deliverables constantly in the pipeline.
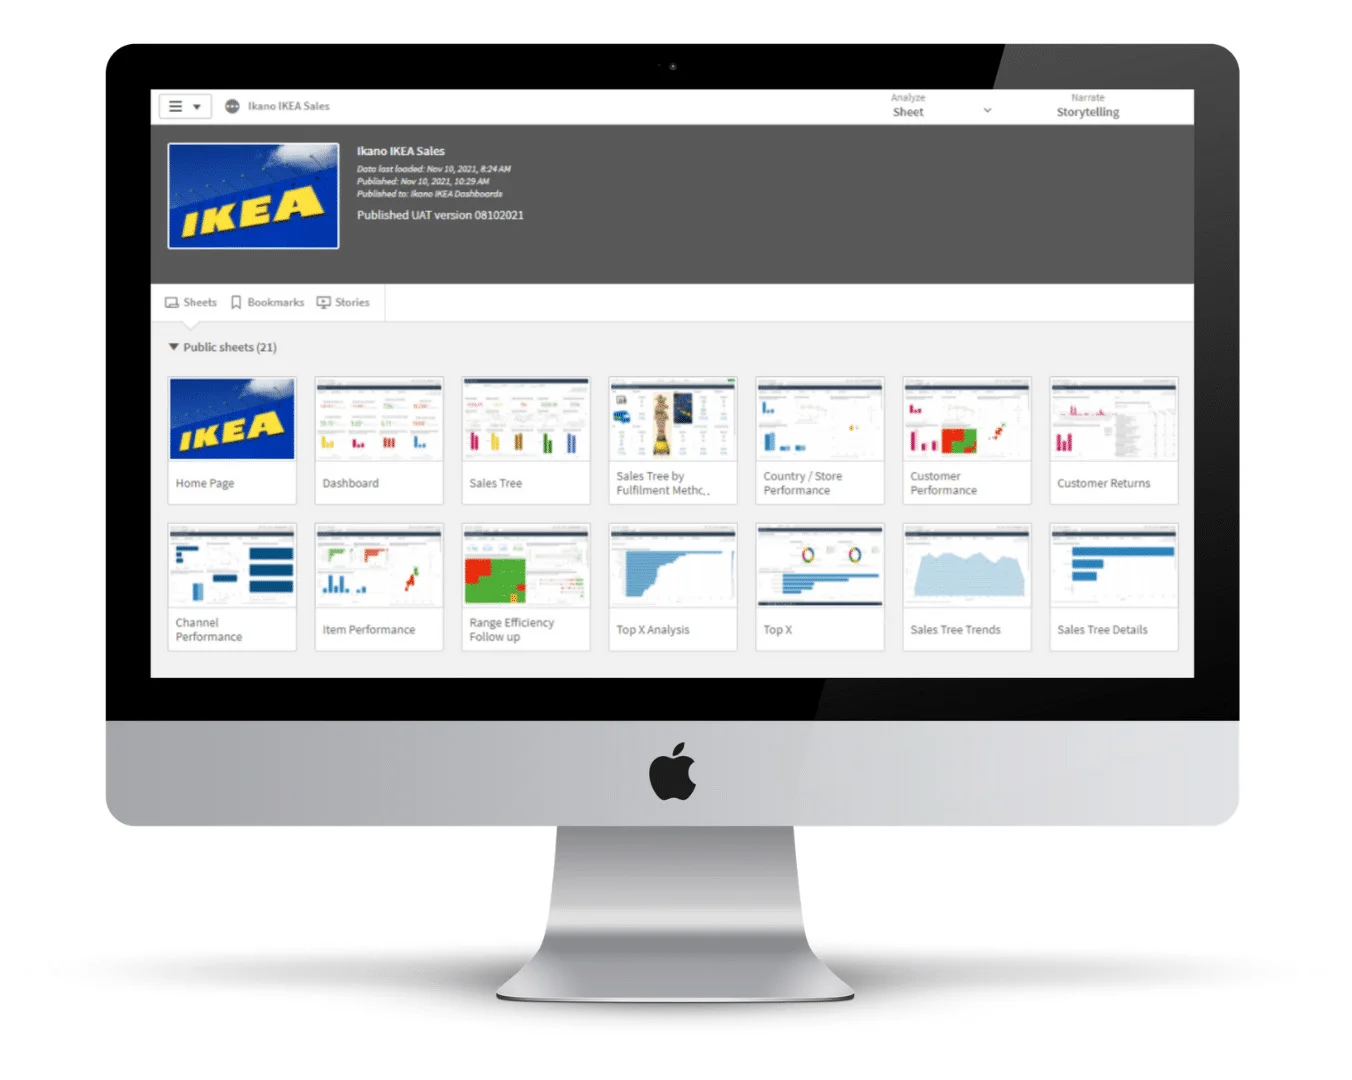
In February 2022, we reached our first major milestone with all multi-channel sales dashboards going live across Southeast Asia and Mexico. The dashboard evolved providing 34 KPIs and 45 filter options across 24 sheets, so co-workers can slice and dice the data however they needed to get the information they seek.
Co-workers can see real-time trends for KPI’s such as:
- Store visits and sales
- Physical and digital customers
- In-store conversion rates
- Numbers of transactions and average number of articles per transaction
- Food purchases
- Fulfilment metrics
To ensure co-workers at Ikano Retail were able to see KPI’s at a regional and individual level, each one has its own dashboard page with customised filtering options.
With data refreshed daily, Ikano Retail co-workers across all Southeast Asia and Mexico now have access to comprehensive and relevant sales data and insight, delivered in a user-friendly way.

1
sales dashboard
656
billion records of data
Related news & insights
Get in touch and have a chat with us
Chat with our experts at a time that suits you, to explore how advanced analytics will change your business.
Drop us a line, leave a message, or fill in the form. Whatever you prefer. We’re here to help.


