

Location Optimiser analysis reveals new audiences for concept store
The client
Retail giant IKEA is on a journey of digital transformation to better understand the needs of customers and provide the best in-store experience possible.
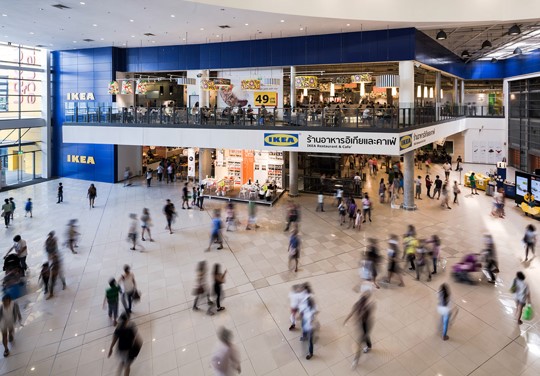
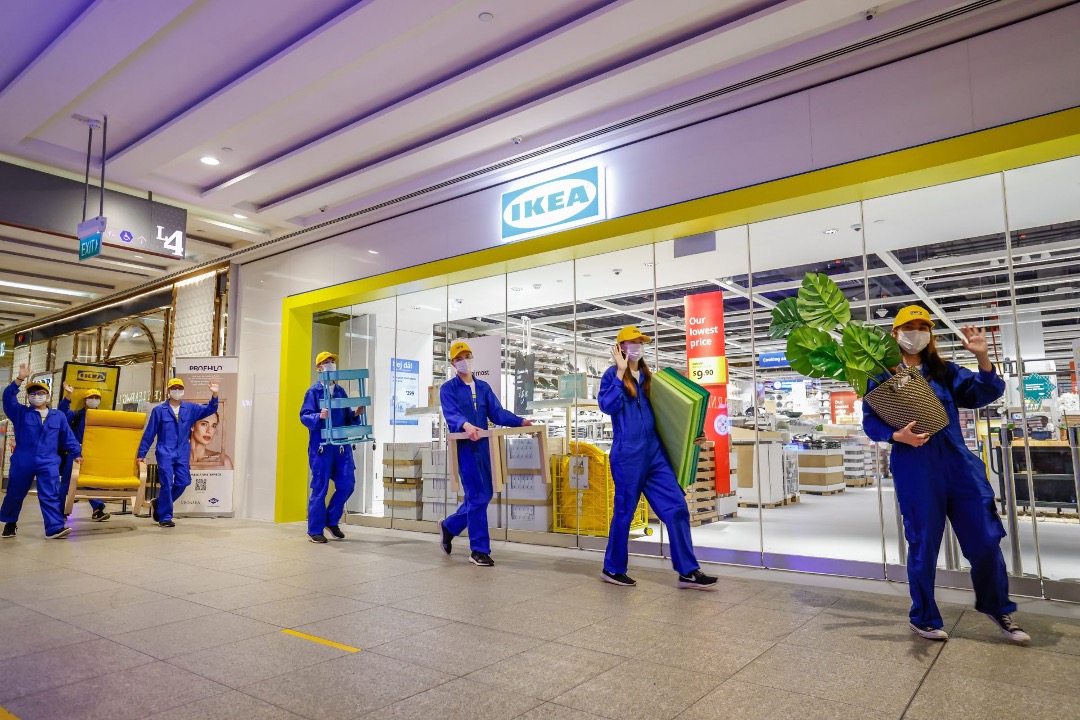
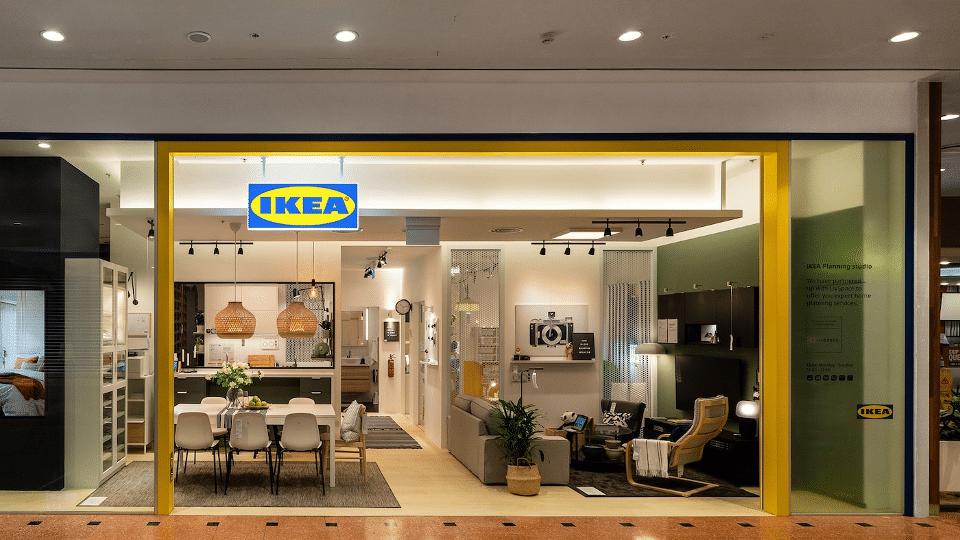
With two large format ‘blue box’ stores already in Singapore, IKEA opened a third ‘concept’ store on the west side in April 2021, making it Southeast Asia’s first small-store concept, promising new experiences with digital solutions.
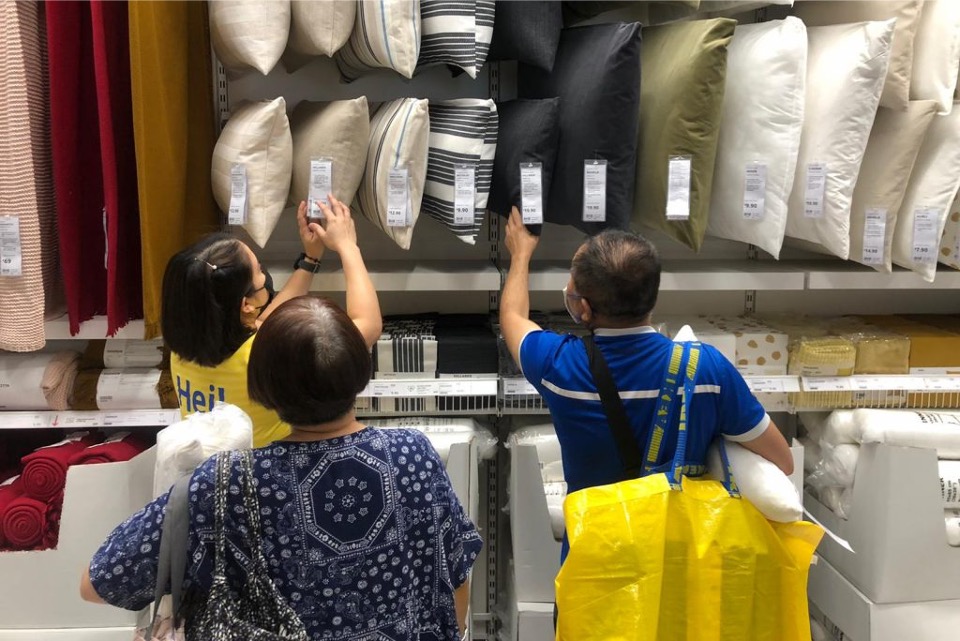
Customers are able to get home furnishing inspiration from over 12 room settings, 16 vignettes and 2 homes depicting life at home living situations in Singapore.
Customers can make purchases through roving store assistants or online. Orders are then delivered straight to the customer’s home. Shoppers can use self-pay checkout options and enlist planning assistance from IKEA staff to map out their dream kitchens, living rooms, or bedrooms.

The challenge
This was the very first time an IKEA store would not be the largest, main tenant within an established shopping centre, and therefore to prove this new concept format, audience visitation patterns, motivations and outcomes would be crucial to understand versus the established single location, blue box stores. Even with its ‘concept’ status, the new store needed to achieve similar levels of success already seen locally at the Tampines and Alexandra stores.
Nigel Richardson, Inspiration and Communication Manager at IKEA Singapore, explains more:
“Even with extensive pre-launch research and planning, it is crucial to understand consumer behaviour in the Singapore market.
Understanding post-launch patterns of visitor demographics, customer journeys, PMA spread & cross-over together with shopping outcomes helps the Singapore Management Team to understand the business and steer outcomes for the future.”

Whilst IKEA already possessed extensive customer data within their Family loyalty programme, they now needed to understand the potential of new audiences, and how to directly access them.
Just a few of the key questions that needed answering:
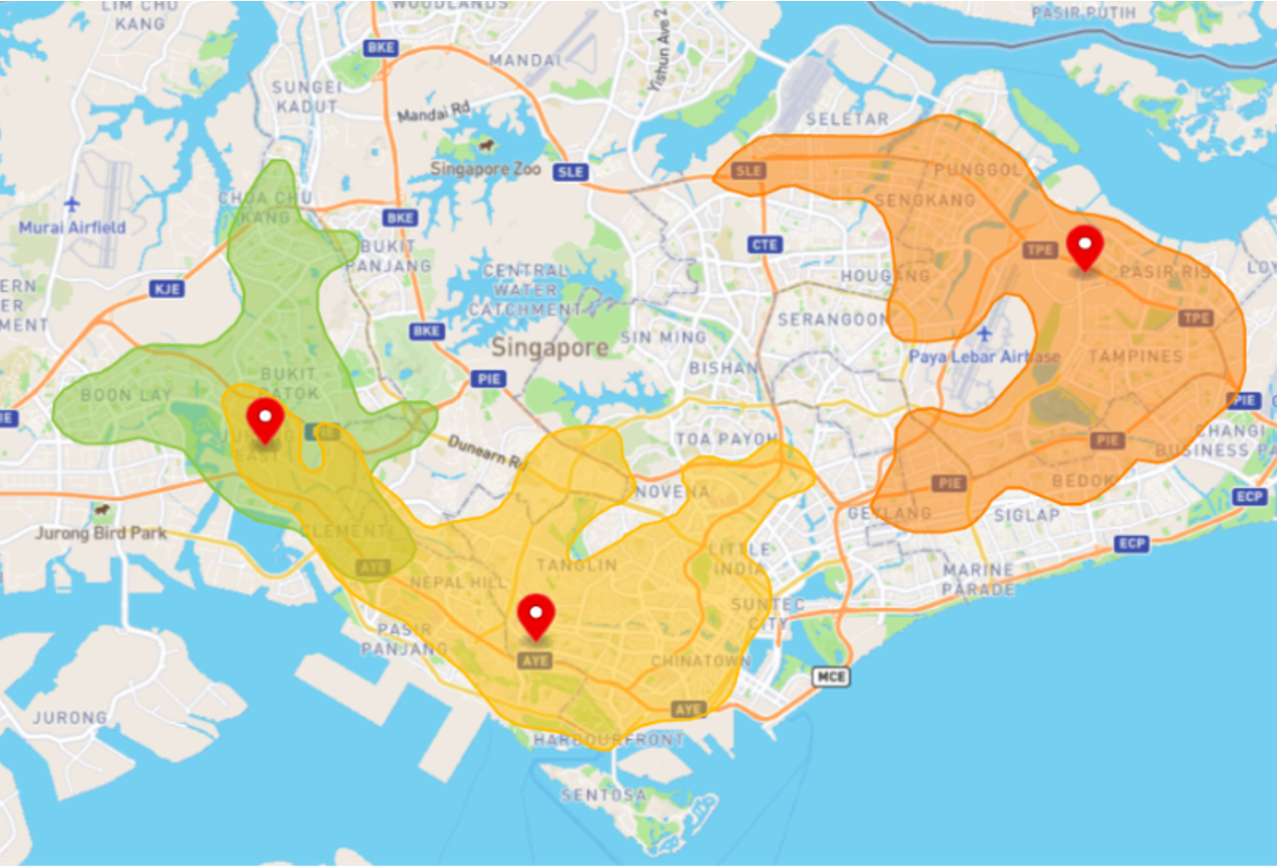
- Based on visitation data and Family membership, what is the catchment area of the Jurong store?
- How does it overlap with the Tampines and Alexandra stores, by geography, by customer profile?
- How does the IKEA visitation relate to the shopping mall visitation?
- Are customers visiting from their home or work locations? How does this change by day-part, day of the week?
Quite simply, IKEA needed to rapidly visualise customer location behaviour, integrated with multiple additional sources of customer profiling data, and customer shopping or transactional data. All in an easy to consume format, that would surface insights quickly, and facilitate positive business decisions.
The solution
Ikano Insight was uniquely placed, with our Location Optimiser analytics product, to offer a purpose made solution for this challenge.
Using Location Optimiser, we were able to map the precise location and space of the store itself, thereby identifying visitors to the store at any given time, including their in-store dwell time. This then allowed the further mapping of those same visitors’ journey patterns and starting locations.
1.6 billion devices globally
70 million location in 44 countries
Accurate to within 3 metres
GPPR/CCPA compliant
In this way we could precisely map catchment areas and migration patterns of store, and also crucially in this case shopping centre visitors too.
By performing analysis before and after the new store opening, we could compare prior patterns from the two established stores with the new three store patterns. Insights revealed include time in store, multi-store visits, individual store visitor overlaps, day of week and time of day of visits, and uniquely common day locations and common evening locations of visitors. This in particular gives rise to analysis of travel patterns where work or home are journey start or end points.
By integrating further data sources, such as member profile and transaction data from the IKEA Family loyalty programme across all 3 stores, we were able to create additional insight layers regarding shopper outcomes such as average transaction values, repeat visits, and loyalty programme penetration.
Additionally the Location Optimiser product allows us to identify and map non-store related behaviour and movement, integrating individual data variables such as mobile app behaviours, external variables such as weather, and business variables such as marketing campaign or competitor actions.
The results
12
percent new visitor base
52
percent visitors under age 35
IKEA were able to determine specific catchment areas for all three stores including overlaps, using IKEA Family data to further understand where IKEA’s customers are located. All 3 stores were found to have distinct catchment areas as store planning had intended. With an immediate 10% overlap identified, the tool pointed to specific targeting opportunities for additional geographic overlap.
A full 12% of visitors are unique to the smaller, concept format, opening enormous opportunity to develop incremental sales opportunity.
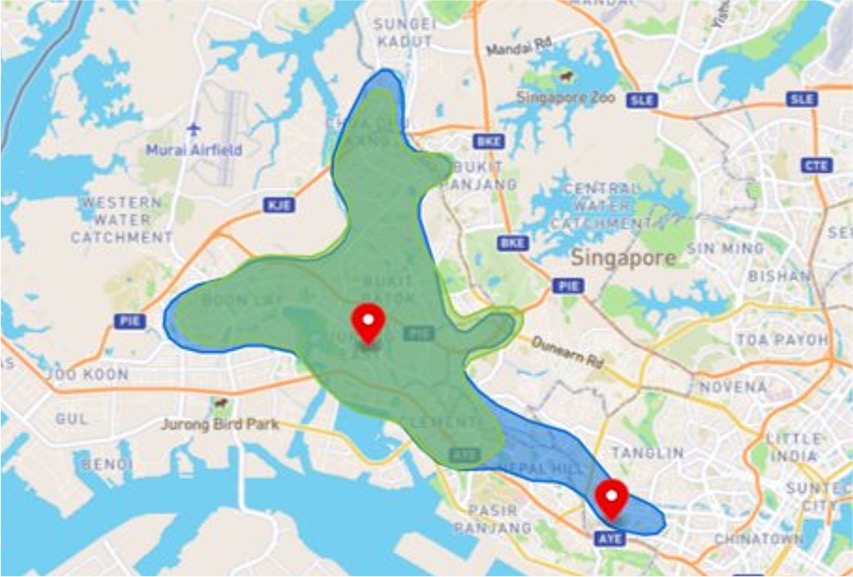
Utilising path mapping and heat-mapping, the tool also identified the most travelled route of Family members and customers to all 3 stores, enabling marketing and outdoor media plans to capitalise on the ideal placement of advertising and engagement messages.
Through analysis of visitation patterns to the new concept store in Jurong, segmenting daytime from evenings, and work versus home origins, it was identified that the Jurong store has succeeded in capturing commuter pathway visits, in part due to its shopping centre location and in part due to its smaller, concept format. The capture of ‘passing trade’, as opposed to dedicated visitors to large store formats, potentially opens IKEA to new audience segments previously unseen, and thus additional revenue potential.
The outcome
We leave the final words of our story once again to our client, Nigel Richardson:
“By working together with Ikano Insight to integrate and analyse data from the Family loyalty programme, and further profiling data with the Location Optimiser tool, we learned more about our consumer demographic and shopping behaviour that informs future marketing plans and commercial objectives for the three stores working together in one IKEA Singapore.
By comparing the difference in transactional behaviour across the stores, plus dwell time analysis we build a picture of the consumer’s habits and cross store shopping journeys. We deliver better and more accurate customer profiles to enhance targeting and communications.
The valuable insights into our audience and their behaviour has already secured Ikano Insights the contract to conduct the same study as we prepare for our second store in Manila, Philippines.”
Related news & insights
Find out more with a personalised demo
If you’d like to know more about location analytics, and how it can accurately identify your market share growth potential, and target the right customers, just get in touch here.
We’ll have a chat and show you a personalised demo to understand exactly what you could achieve.