

ESG reporting
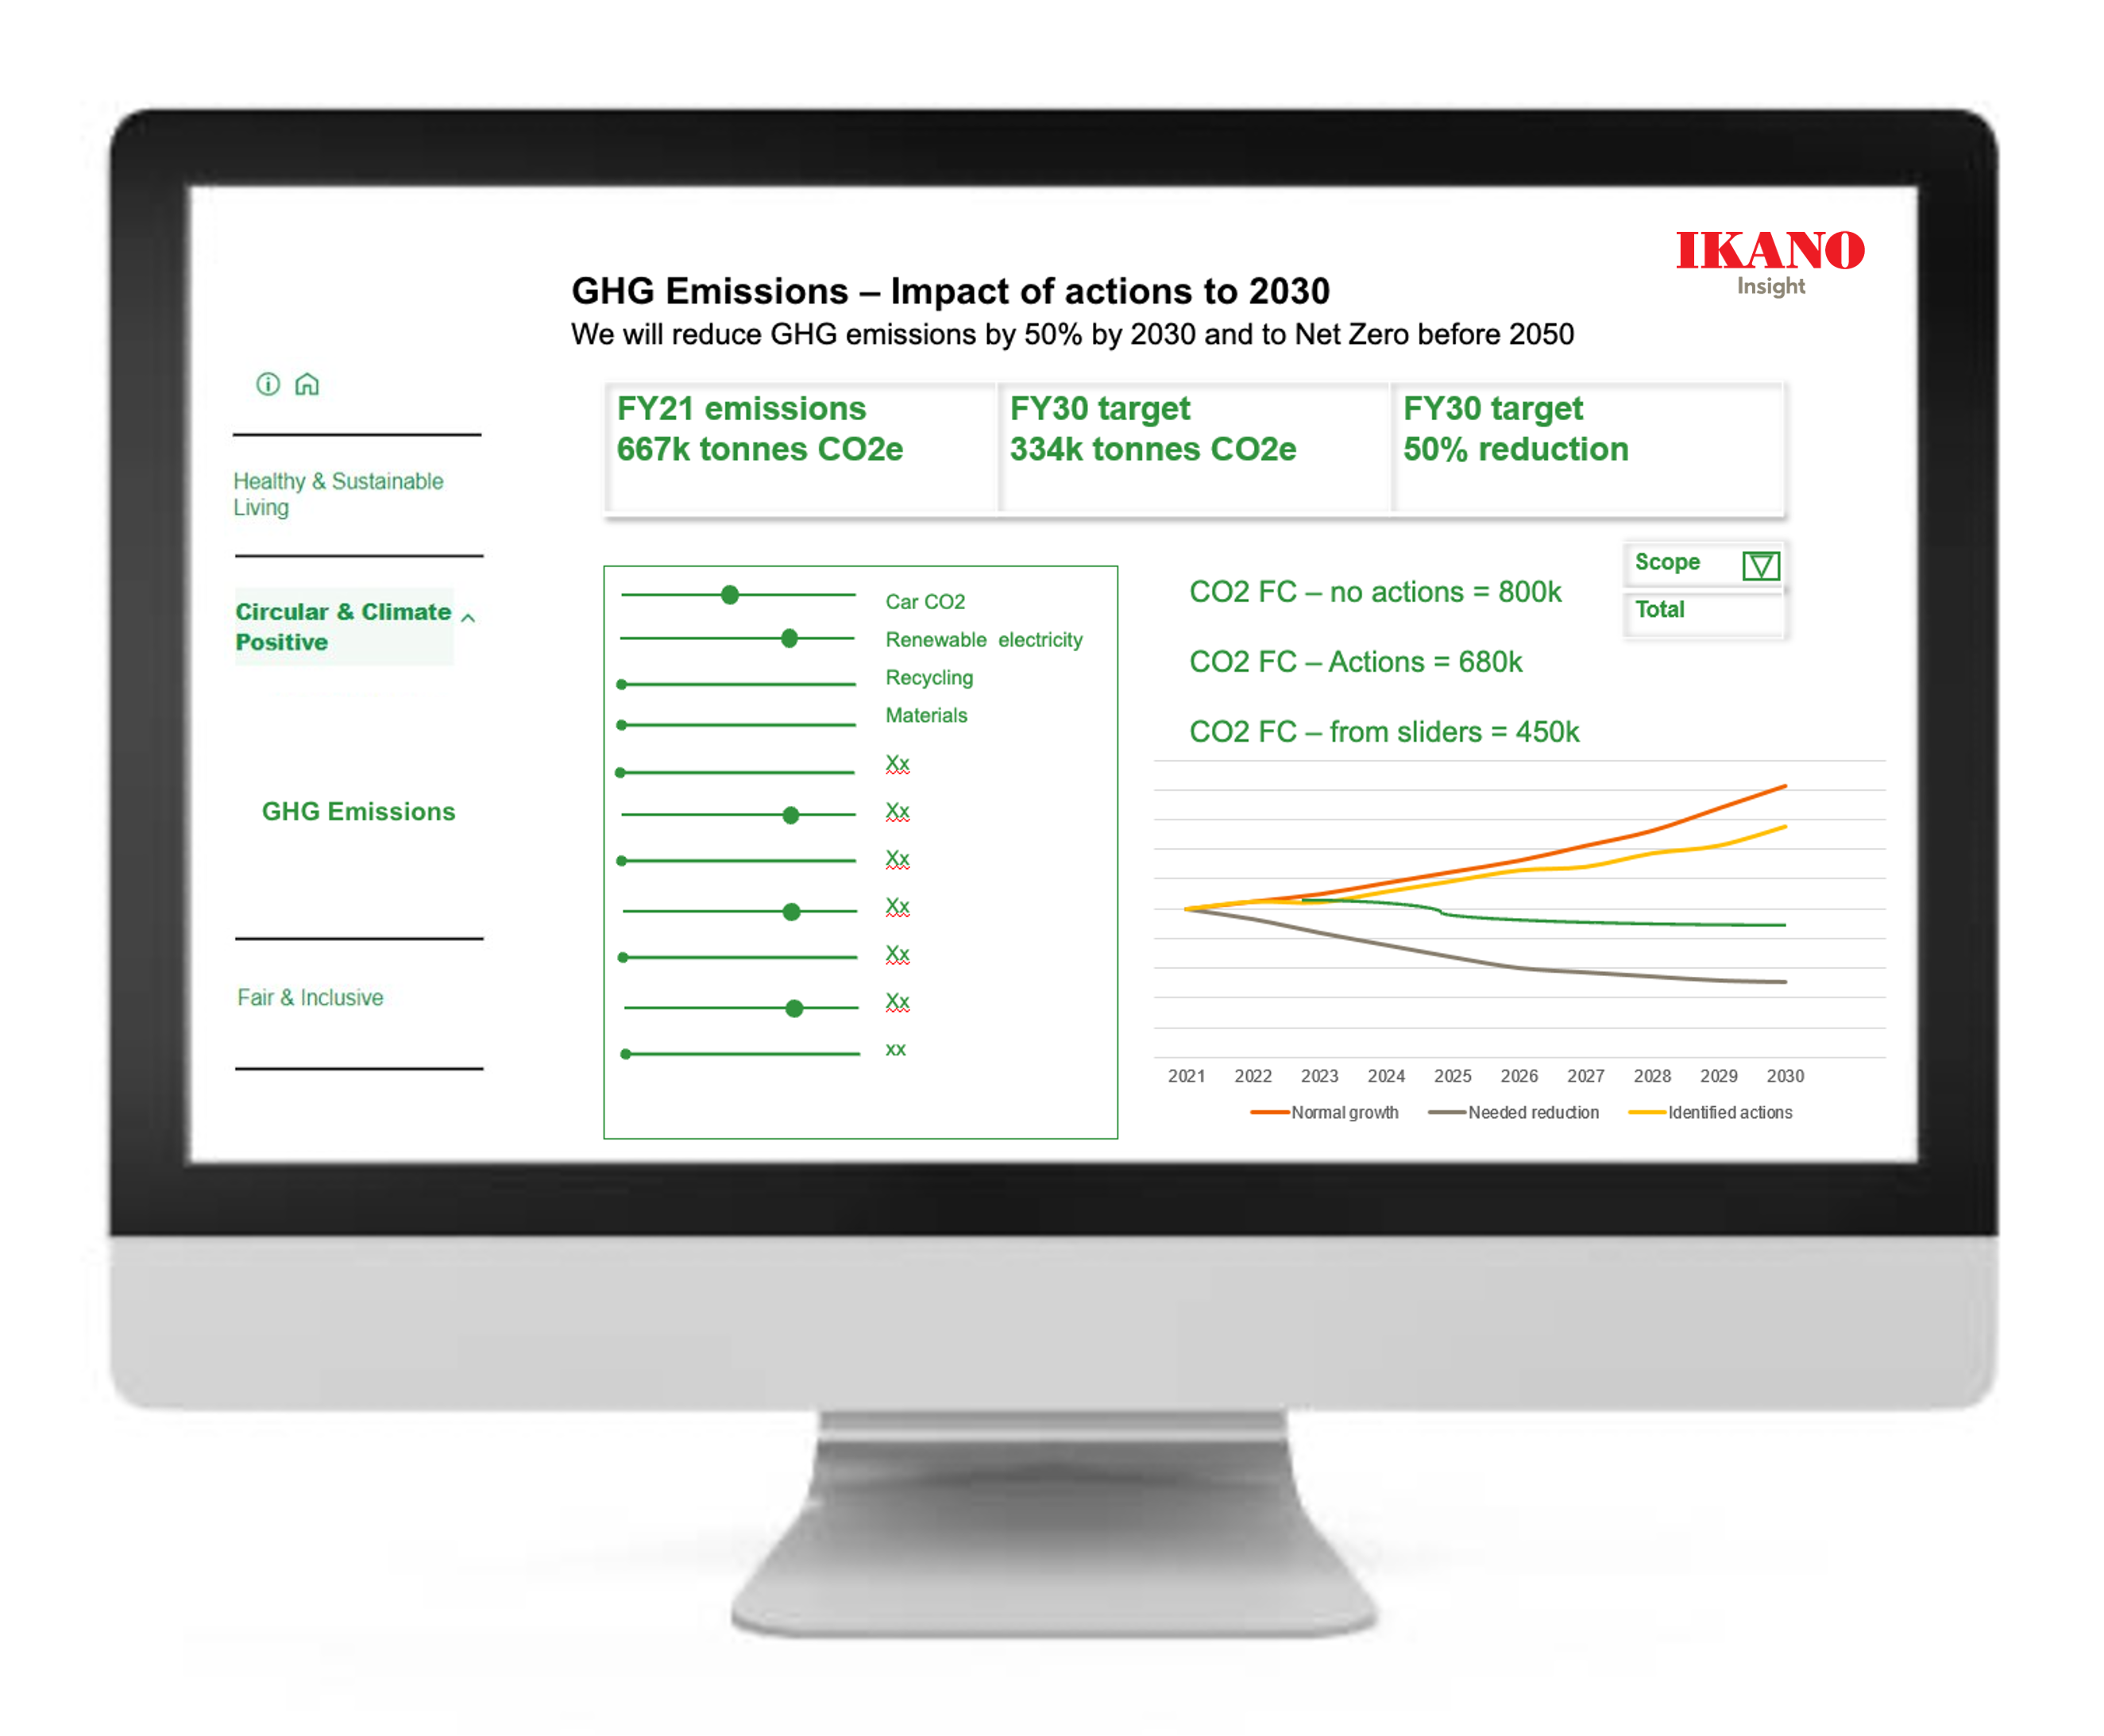
Greenhouse gas emissions dashboard
Easily report your GHG emissions to comply with new legislation
Book your ESG Optimiser demo hereConsolidate your GHG emissions reporting, forecast future impact, and identify actions to meet your targets
Our GHG emissions dashboard captures and visualises all your emissions data, from raw materials to end of life products in one place, visible to your key stakeholders, creating a focus on required actions.
Building a GHG emissions dashboard
There are 3 key stages to the dashboard enablement process, which will put your business in a commanding position in control of GHG emissions data, able to report and comply with legislation, and to manage your roadmap to emissions reduction and net zero:
Data consolidation and assessment
Aggregates GHG emissions data from all parts of your business, along with business growth data, to create a predictive dataset that forecasts GHG impact based upon your sustainability action plan.
Dashboard design and enablement
Personalised dashboard design which displays, data, trends and actions-based outcome predictions, all available online to authorised viewers of your company.
Feasibility analysis and reporting
Collaboration with your senior business leaders to quantify costs and benefits of GHG emissions reduction, output to a report, which enables business decisions and affirmative sustainability action.
Would you like to see how ESG Optimiser – our fully integrated ESG data and analytics platform works?
Book a 30 minute demo, and chat with an ESG data expert
Capture your GHG emissions data, report accurately, and build your roadmap to net zero
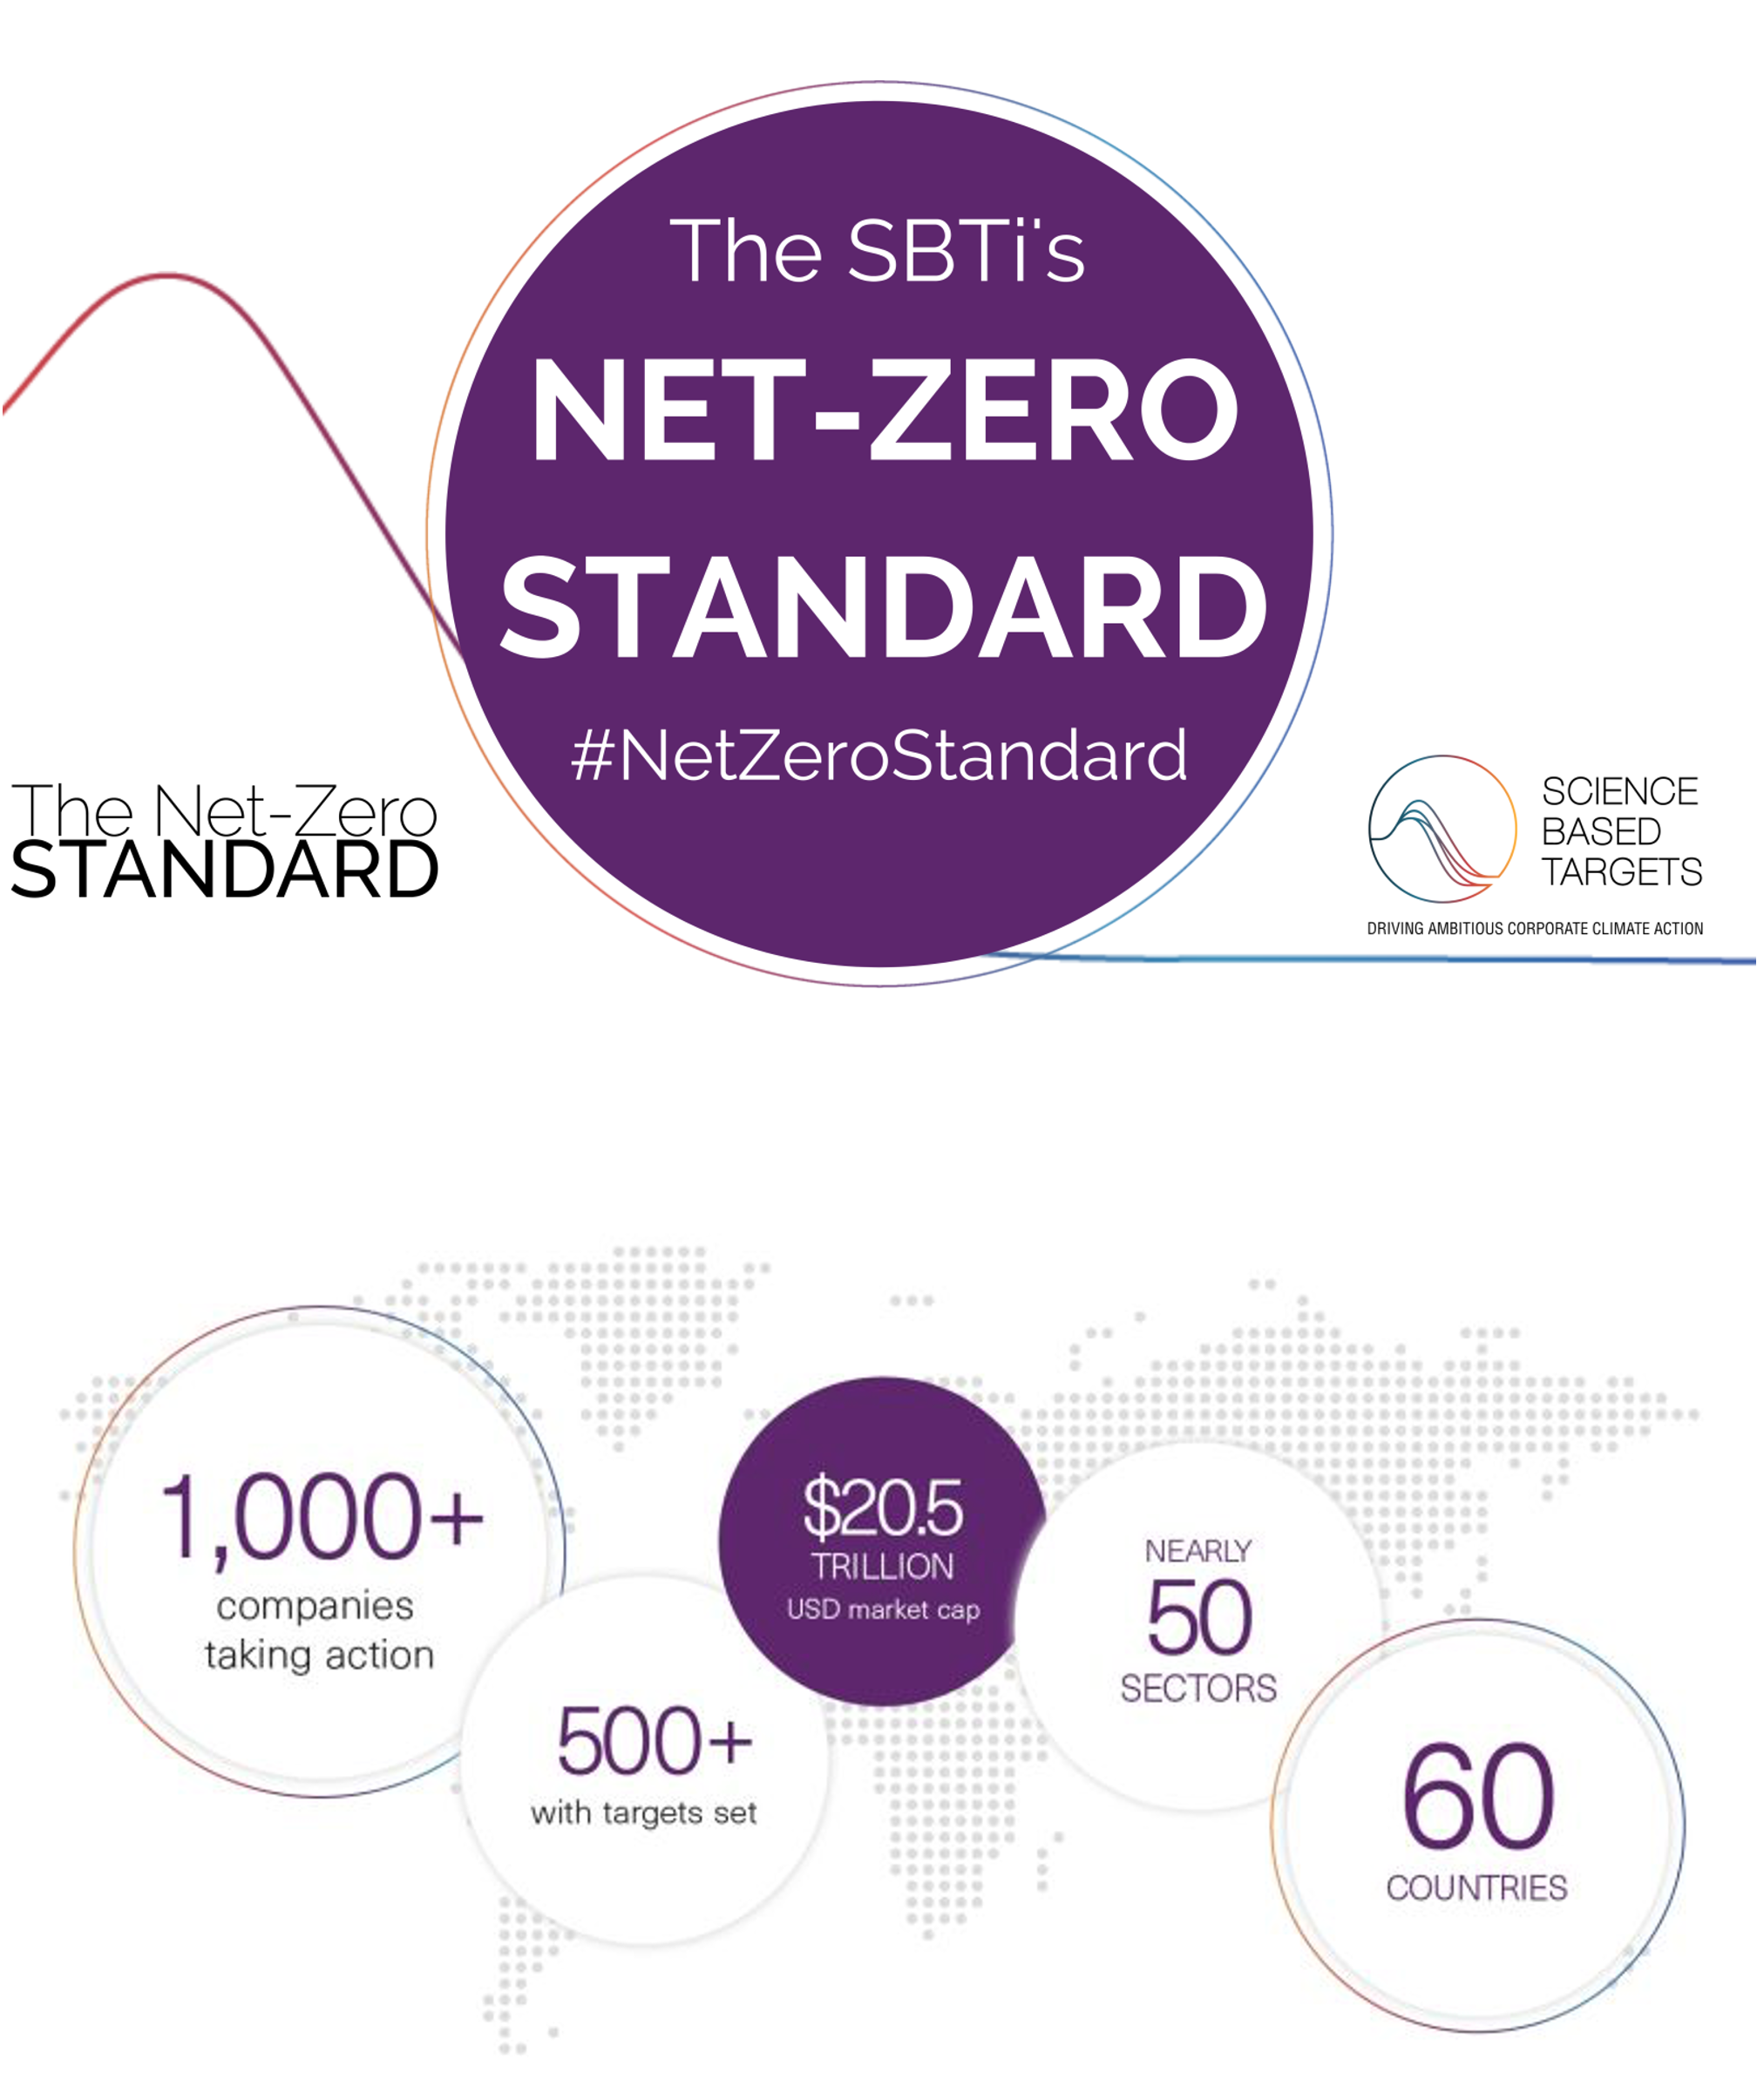
Harness and use your data to achieve a net zero emissions strategy in line with your targets. Be in a commanding data-led position to sign your company up to the Science Based Targets initiative (SBTi)
See all your GHG emissions data in one place
Forecast GHG emissions impact of business actions and growth
Empower stakeholders to make decisions and take action
Avoid greenwashing and qualify for Science Based Targets
Calculate costs and benefits of GHG emissions reduction
Be a good business for your customers and the planet
If you haven’t seen an overview of the complete ESG Optimiser solution, with 9 integrated platform modules, an additional 5 specialist tools, and a comprehensive implementation and support service, just click here.
Frequently asked questions
What is a GHG emissions dashboard?
A GHG emissions dashboard is a visual tool that displays greenhouse gas emissions data in real-time or through periodic updates. It provides a comprehensive and interactive overview of emissions from various sources, such as industries, transportation, energy production, and more. These dashboards help organisations, businesses, and governments monitor, track, and manage their carbon footprint to address climate change concerns effectively.
How do GHG emissions dashboards work?
GHG emissions dashboards work by collecting emissions data from multiple sources, including sensors, monitoring equipment, databases, and manual inputs. The data is then processed, aggregated, and presented in a user-friendly and visually appealing format. Users can interact with the dashboard, analyse trends, set emission reduction goals, and make informed decisions to mitigate their carbon impact.
What types of data are typically shown in a GHG emissions dashboard?
GHG emissions dashboards commonly display data related to carbon dioxide (CO2), methane (CH4), nitrous oxide (N2O), and other greenhouse gases. The data can include emissions by sector, geographic location, emission sources, emission intensity, historical trends, and comparisons against targets.
What are the benefits of using GHG emissions dashboards?
Using GHG emissions dashboards offers several advantages, including:
- Enhanced visibility and understanding of emissions patterns
- Facilitates data-driven decision-making for emission reduction strategies
- Enables tracking progress toward environmental goals and targets
- Identifies areas for efficiency improvements and cost savings
- Demonstrates transparency and accountability in environmental reporting.
How can I get started with a GHG emissions dashboard for my organisation?
To get started with a GHG emissions dashboard, follow these steps:
- Assess your organisation’s emissions data needs and objectives.
- Identify suitable dashboard software or providers that align with your requirements.
- Integrate data sources and ensure data accuracy and quality.
- Customise the dashboard to display the most relevant information for your stakeholders.
- Train your team members to use and interpret the dashboard effectively.
- Regularly update and maintain the dashboard to keep track of changing emissions patterns.
Book a demo

Let’s chat!
If you’d like to chat with us to see how we can help you achieve your sustainability goals, including measurement, reporting and compliance, just pick a time that suits you in Peter’s calendar.

Peter Jones
Sustainability discussion
Chat with Head of Sustainability Peter Jones, about your sustainability requirements, at a time that suits you. And see the platform for yourself in a quick demo.
 30mins
 Online web chat
Review your sustainability objectives, challenges and see which platform modules would match your needs.
Get in touchLet’s chat!
If you’d like to chat with us to see how we can help you achieve your sustainability goals, including measurement, reporting and compliance, just pick a time that suits you in Peter’s calendar.
Review your sustainability objectives, challenges and see which platform modules would match your needs.
Related modules
ESG frameworks and reporting
Report to multiple major frameworks from one dataset
ESG building benchmarks and ratings
Simplify data collection and reporting across your property portfolio
Track ESG goals with sustainability dashboards
Visualise sustainability data in one place for stakeholders and team members