
ESG Optimiser module
Interval meter data analytics software for ESG reporting
Drive energy efficiency across facilities with interval meter analytics
Book your ESG Optimiser demo hereAutomate the capture and analysis of high-resolution meter data to drive energy efficiency
Driving energy efficiency across a large portfolio of energy-intensive facilities requires the capture and analysis of multiple granular data sets to help businesses understand their energy usage patterns and change behaviour to meet sustainability goals faster.
Interval meter analytics consolidates data from utility meter providers and sub-metering systems to simplify and standardise the monitoring of utility demand and consumption data at a granular level.
With powerful data analytics, benchmarking and workflow tools, it provides a contextualised view of interval meter data with other facility attributes to pinpoint inefficient facilities and highlight those with the highest cost and energy savings potential.
Module features
Utility performance management
Drill down from portfolio-wide views to individual groups, locations or meters and report on a range of utility performance metrics including consumption, demand, emissions and relative energy and water intensity.
Data modeling
Our integrated regression modelling tool enables you to normalise energy performance for weather and KPI metrics, so you can measure and track savings against baseline periods over time.
Visualisation and reporting
View your meter data through integrated dashboards and reports, allowing you to analyse utility demand and consumption from multiple perspectives at varying levels of granularity.
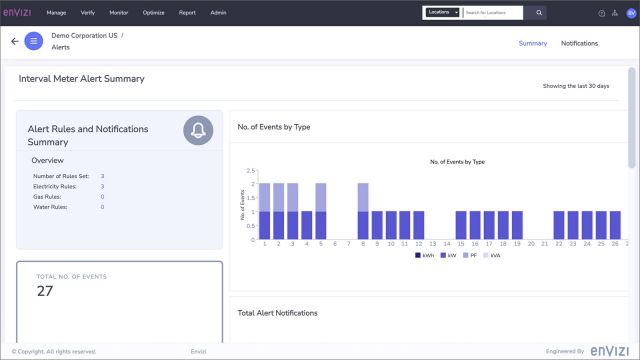
Meter based alerts
Use day-of-week and weather-correction data models to auto-generate alerts when demand or consumption varies from expected values. Triage, prioritise and assign issues for investigation and resolution using Kanban-style issue boards.
Would you like to see how ESG Optimiser – our fully integrated ESG data and analytics platform works?
Book a 30 minute demo, and chat with an ESG data expert
Drive energy efficiency by automating capture and analysis of high-resolution meter data.
Report on water and energy consumption across your portfolio to inform where to target your biggest consumption, cost and emissions-reduction efforts.
Compare energy and water intensities across facilities to identify efficiency improvements
Leverage integrated workflow tools to assign tracking and management of issues

If you haven’t seen an overview of the complete ESG Optimiser solution, with 9 integrated platform modules, an additional 5 specialist tools, and a comprehensive implementation and support service, just click here.
Your ESG team
Ikano Insight’s team of expert sustainability consultants will guide your business through all aspects of sustainability strategy, from data management to GHG calculations, framework reporting to legislative audits and compliance, and software implementation to business performance improvement.
Our team are there to help you every step of the way, as little or as much as you need, on your sustainability journey.
Head of Sustainability
Peter Jones
peter.jones@insight.ikano
Snr Sustainability Business Analyst
Innes Christison
innes.christison@insight.ikano
Sustainability Business Analyst
Emily Blenkley
emily.blenkley@insight.ikano
Head of Sales
Jonathan Otter
jonathan.otter@insight.ikano
Peter Jones
Head of Sustainability
Innes Christison
Snr Sustainability Business Analyst
Emily Blenkley
Sustainability Business Analyst
Jonathan Otter
Head of Sales
Frequently asked questions
What is interval meter data, and why is it important for businesses?
Interval meter data refers to detailed energy consumption data collected at regular intervals (e.g., every 15 minutes) from utility meters. It provides granular insights into how energy is being used within a business. Understanding interval meter data is crucial for businesses to identify energy usage patterns, optimise operations, and make informed decisions for energy efficiency and cost savings.
How can businesses access interval meter data?
Businesses can typically access interval meter data from their utility companies or energy providers. Most utilities offer online portals or data download services to access and download the interval data. Alternatively, businesses can request the data directly from the utility company.
What are the main benefits of analysing interval meter data for businesses?
Analysing interval meter data offers several benefits to businesses, including:
- Identifying peak usage periods to optimise energy consumption and reduce demand charges.
- Uncovering abnormal energy usage patterns that may indicate equipment malfunctions or inefficiencies.
- Assessing the effectiveness of energy-saving initiatives and sustainability efforts.
- Facilitating data-driven decision-making for energy management strategies.
- Accurate forecasting of energy costs and budget planning.
How can businesses detect anomalies or irregularities in their interval meter data?
Detecting anomalies in interval meter data can be achieved through statistical analysis and data visualisation techniques. Businesses can use methods like moving averages, standard deviations, and machine learning algorithms to identify unusual spikes or dips in energy usage. Data visualisation can also help spot irregular patterns that may indicate operational issues.
Can interval meter data analysis help with demand response strategies?
Yes, analysing interval meter data is instrumental in implementing demand response strategies. By identifying peak demand periods, businesses can participate in demand response programs to curtail energy usage during critical times and receive incentives from utility providers for reducing their load.
How can businesses use interval meter data to optimise their energy consumption?
Businesses can optimise energy consumption using interval meter data by:
- Scheduling energy-intensive operations during off-peak hours.
- Identifying energy waste and improving operational efficiency.
- Implementing load balancing techniques to avoid demand spikes.
- Benchmarking energy usage across different sites or periods to identify best practices.
- Investing in energy-efficient equipment based on data-driven insights.
Book a demo

Let’s chat!
If you’d like to chat with us to see how we can help you achieve your sustainability goals, including measurement, reporting and compliance, just pick a time that suits you in Peter’s calendar.

Peter Jones
Sustainability discussion
Chat with Head of Sustainability Peter Jones, about your sustainability requirements, at a time that suits you. And see the platform for yourself in a quick demo.
 30mins
 Online web chat
Review your sustainability objectives, challenges and see which platform modules would match your needs.
Get in touchLet’s chat!
If you’d like to chat with us to see how we can help you achieve your sustainability goals, including measurement, reporting and compliance, just pick a time that suits you in Peter’s calendar.
Review your sustainability objectives, challenges and see which platform modules would match your needs.
Related modules
Utility bill data analysis
Consolidate utility bill data across your portfolio
Sustainability programme tracking
A single platform to capture and report ESG and sustainability data
Track ESG goals with sustainability dashboards
Visualise sustainability data in one place for stakeholders and team members